4-2. 앙상블 학습
In [1]:
from IPython.core.display import display, HTML
display(HTML("<style> .container{width:90% !important;}</style>"))

1. 앙상블 학습이란?

앙상블(Ensemble) 학습

앙상블이란 여러 개의 알고리즘을 사용하여, 그 예측을 결함함으로써 보다 정확한 예측을 도출하는 기법을 말합니다.
집단지성이 힘을 발휘하는 것처럼 단일의 강한 알고리즘보다 복수의 약한 알고리즘이 더 뛰어날 수 있다는 생각에 기반을 두고 있습니다.

이미지, 영상, 음성 등의 비정형 데이터의 분류는 딥러닝이 뛰어난 성능을 보이지만,
대부분 정형 데이터의 분류에서는 앙상블이 뛰어난 성능을 보이고 있다고 합니다.

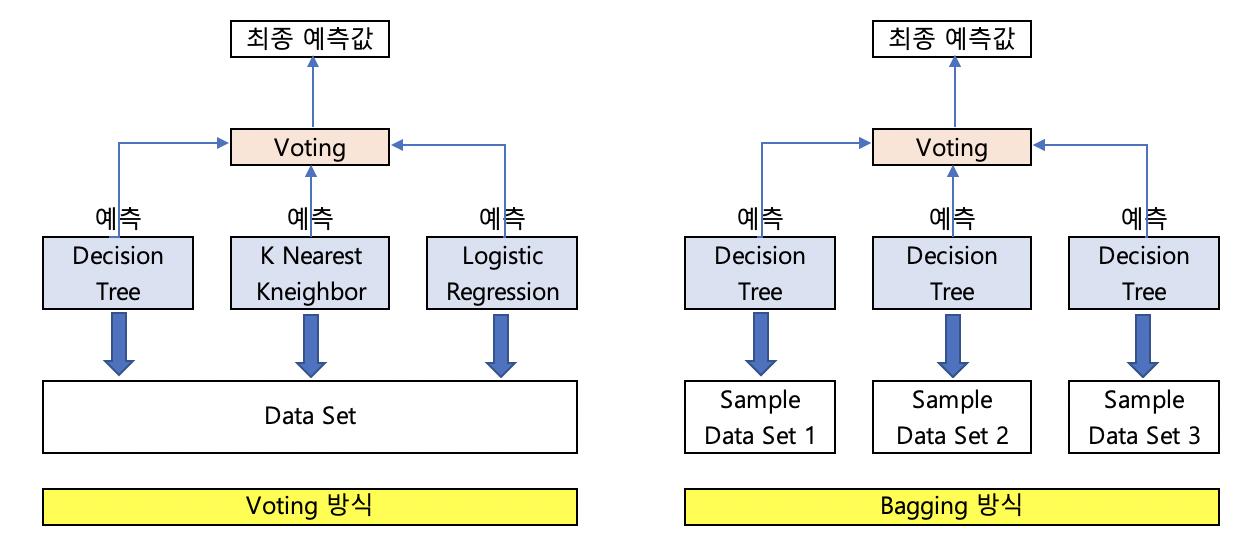
앙상블 학습의 유형은 보팅(Voting), 배깅(Bagging), 부스팅(Boosting), 스태킹(Stacking) 등이 있습니다.

보팅은 여러 종류의 알고리즘을 사용한 각각의 결과에 대해 투표를 통해 최종 결과를 예측하는 방식입니다.
배깅은 같은 알고리즘에 대해 데이터 샘플을 다르게 두고 학습을 수행해 보팅을 수행하는 방식입니다.
이 때의 데이터 샘플은 중첩이 허용됩니다. 즉 10000개의 데이터에 대해 10개의 알고리즘이 배깅을 사용할 때,
각 1000개의 데이터 내에는 중복된 데이터가 존재할 수 있습니다.
배깅의 대표적인 방식이 Random Forest 입니다.

부스팅은 여러 개의 알고리즘이 순차적으로 학습을 하되, 앞에 학습한 알고리즘 예측이 틀린 데이터에 대해
올바르게 예측할 수 있도록, 그 다음번 알고리즘에 가중치를 부여하여 학습과 예측을 진행하는 방식입니다.

마지막으로 스태킹은 여러 가지 다른 모델의 예측 결과값을 다시 학습 데이터로 만들어 다른 모델(메타 모델)로
재학습시켜 결과를 예측하는 방법입니다.
2. 하드보팅(Hard Voting)과 소프트보팅(Soft Voting)

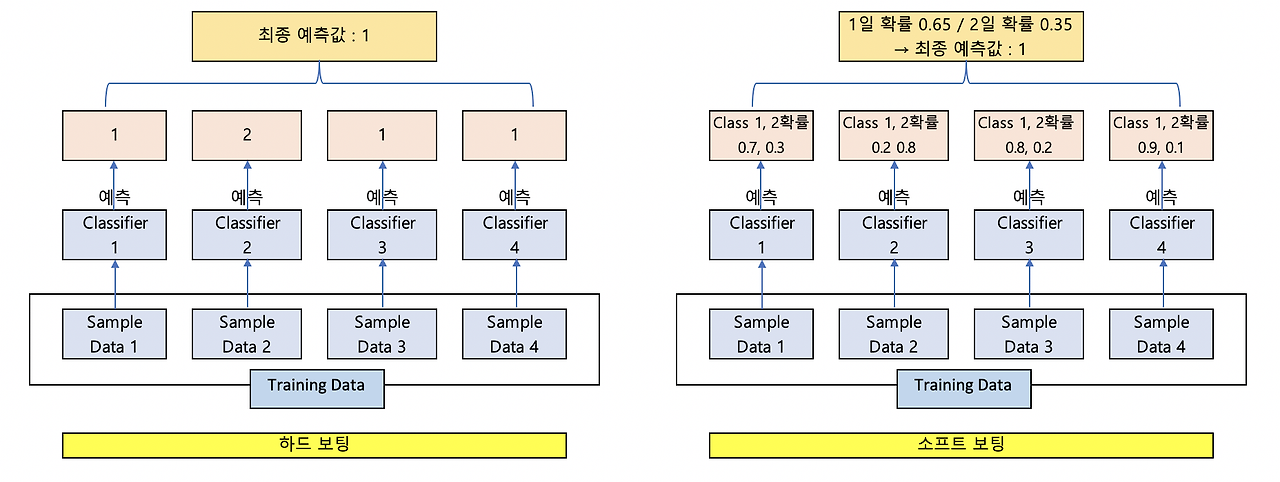
하드보팅을 이용한 분류는 다수결 원칙과 비슷합니다.
소프트 보팅은 각 알고리즘이 레이블 값 결정 확률을 예측해서, 이것을 평균하여 이들 중 확률이 가장 높은 레이블 값을 최종 값으로 예측합니다.

일반적으로는 소프트 보팅이 성능이 더 좋아서 많이 적용됩니다.
3. 보팅 분류기(Voting Classifier)

사이킷런은 보팅방식의 앙상블을 구현한 VotingClassifier 클래스를 제공하고 있습니다.

사이킷런에서 제공되는 위스콘신 유방암 데이터 세트를 이용해 보팅방식의 앙상블을 적용해보겠습니다.

In [2]:
# 필요한 모듈과 데이터 불러오기
import pandas as pd

from sklearn.ensemble import VotingClassifier
from sklearn.linear_model import LogisticRegression
from sklearn.neighbors import KNeighborsClassifier
from sklearn.datasets import load_breast_cancer
from sklearn.model_selection import train_test_split
from sklearn.metrics import accuracy_score

from warnings import filterwarnings
filterwarnings('ignore')

cancer = load_breast_cancer()

data_df = pd.DataFrame(cancer.data, columns = cancer.feature_names)
data_df.head(3)
Out[2]:
mean radius mean texture mean perimeter mean area mean smoothness mean compactness mean concavity mean concave points mean symmetry mean fractal dimension ... worst radius worst texture worst perimeter worst area worst smoothness worst compactness worst concavity worst concave points worst symmetry worst fractal dimension
0 17.99 10.38 122.8 1001.0 0.11840 0.27760 0.3001 0.14710 0.2419 0.07871 ... 25.38 17.33 184.6 2019.0 0.1622 0.6656 0.7119 0.2654 0.4601 0.11890
1 20.57 17.77 132.9 1326.0 0.08474 0.07864 0.0869 0.07017 0.1812 0.05667 ... 24.99 23.41 158.8 1956.0 0.1238 0.1866 0.2416 0.1860 0.2750 0.08902
2 19.69 21.25 130.0 1203.0 0.10960 0.15990 0.1974 0.12790 0.2069 0.05999 ... 23.57 25.53 152.5 1709.0 0.1444 0.4245 0.4504 0.2430 0.3613 0.08758

3 rows × 30 columns

로지스틱회귀와 KNN을 기반으로 하여 소프트 보팅 방식으로 보팅 분류기를 만들어 보겠습니다.

In [3]:
# 보팅 적용을 위한 개별 모델은 로지스틱 회귀와 KNN입니다.
logistic_regression = LogisticRegression()
knn = KNeighborsClassifier(n_neighbors=8)

# 개별모델을 소프트보팅 기반의 앙상블 모델로 구현한 분류기
voting_model = VotingClassifier(estimators=[ ('LogisticRegression', logistic_regression), ('KNN', knn)], voting='soft')

# 데이터를 훈련셋과 테스트셋으로 나누기
X_train, X_test, y_train, y_test = train_test_split(cancer.data, cancer.target, test_size=0.2, random_state=156)

# 보팅 분류기의 학습/예측/평가
voting_model.fit(X_train, y_train)
pred = voting_model.predict(X_test)
print('보팅 분류기의 정확도: {0: .4f}'.format(accuracy_score(y_test, pred)))

# 개별 모델의 학습/예측/평가
classifiers = [logistic_regression, knn]
for classifier in classifiers:
    classifier.fit(X_train, y_train)
    pred = classifier.predict(X_test)
    class_name = classifier.__class__.__name__
    print('{0} 정확도: {1:.4f}'.format(class_name, accuracy_score(y_test, pred)))
보팅 분류기의 정확도:  0.9561
LogisticRegression 정확도: 0.9474
KNeighborsClassifier 정확도: 0.9386

보팅 분류기의 정확도가 각 개별 모델의 정확도보다 조금 높게 나타났습니다.
하지만 여러 알고리즘을 결합한다고 항상 성능이 향상되는 것은 아닙니다.

(필사커널) 190717 EDA To Prediction(DieTanic)
In [1]:
from IPython.core.display import display, HTML
display(HTML("<style> .container{width:90% !important;}</style>"))

경진대회 : Titanic: Machine Learning from Disaster
https://www.kaggle.com/c/titanic

원본 커널 : EDA To Prediction(DieTanic)
https://www.kaggle.com/ash316/eda-to-prediction-dietanic

Contents of the Notebook

Part 1. EDA:

(1) Feature 분석

(2) 여러 Feature들간의 관계나 트렌드 찾기

Part 2. Feature Engineering and Data Cleansing:

(1) 새로운 Feature 더하기

(2) Redundant한 Feature 제거

(3) Feature를 모델링에 적합한 형태로 변환하기

Part 3. Predictive Modeling

(1) 기본 알고리즘 수행

(2) Cross Validation

(3) Ensembling

(4) 중요한 Feature 추출

Part 1. Exploratory Data Analysis(EDA):

In [2]:
import numpy as np
import pandas as pd
import matplotlib.pyplot as plt
import seaborn as sns
plt.style.use('fivethirtyeight')
import warnings
warnings.filterwarnings('ignore')
%matplotlib inline
In [3]:
data = pd.read_csv('input/train.csv')
In [4]:
data.head()
Out[4]:
PassengerId Survived Pclass Name Sex Age SibSp Parch Ticket Fare Cabin Embarked
0 1 0 3 Braund, Mr. Owen Harris male 22.0 1 0 A/5 21171 7.2500 NaN S
1 2 1 1 Cumings, Mrs. John Bradley (Florence Briggs Th... female 38.0 1 0 PC 17599 71.2833 C85 C
2 3 1 3 Heikkinen, Miss. Laina female 26.0 0 0 STON/O2. 3101282 7.9250 NaN S
3 4 1 1 Futrelle, Mrs. Jacques Heath (Lily May Peel) female 35.0 1 0 113803 53.1000 C123 S
4 5 0 3 Allen, Mr. William Henry male 35.0 0 0 373450 8.0500 NaN S
In [5]:
data.isnull().sum() # 전체 Null 값 확인
Out[5]:
PassengerId      0
Survived         0
Pclass           0
Name             0
Sex              0
Age            177
SibSp            0
Parch            0
Ticket           0
Fare             0
Cabin          687
Embarked         2
dtype: int64

Age, Cabin, Embarked 에 Null 값이 있습니다. 나중에 이것들을 수정해보겠습니다.

얼마나 생존을 했을까??

In [6]:
f, ax = plt.subplots(1, 2, figsize=(15, 6))

data['Survived'].value_counts().plot.pie(explode = [0,0.1], autopct = '%1.1f%%', ax=ax[0], shadow=True)
ax[0].set_title('Survived')
ax[0].set_ylabel(' ')

sns.countplot('Survived', data=data, ax=ax[1])
ax[1].set_title('Survived')

plt.show()

많은 탑승객들이 생존하지 못했습니다.

Training Set의 891명 탑승객 중 약 350명(38.4%)만이 이 사고로부터 생존했습니다.

데이터로부터 다른 인사이트를 얻고 어떤 유형의 탑승객이 생존했고, 그렇지 못했는지 살펴보기 위해 더 들어가보갰습니다.

데이터셋의 여러 feature들을 사용해서 생존률을 체크해보겠습니다.

다룰 feature들은 Sex(성별), Port of Embarkation(탑승항구), Age(연령) 등 입니다.

먼저 feature들의 유형에 대해 이해해보겠습니다.

Feature의 유형

  • Categorical Features: (카테고리형 Feature)

    카테고리형 변수(Categorical Variable)은 그 값으로 두개 이상의 카테고리를 가지고 각각의 값으로 feature가 카테고리화 될 수 있습니다.
    예를 들어 성별은 두개의 카테고리(남성과 여성)를 가진 카테고리형 변수입니다. 이런 변수는 순서를 부여할 수가 없습니다.
    다른 말로 명목변수(Nomial Variable) 라고도 합니다.

- 데이터셋의 Categorical Feature : Sex, Embarked
  • Ordinal Features: (순서형 Feature)

    : 순서형 변수(Ordinal Variable)은 카테고리형 변수와 비슷하지만, 변수 안 각 값들간 상대적인 순서, 분류를 부여할 수 있다는 점이 다릅니다.
    가령, Tall, Medium, Short의 값을 가진 Height와 같은 feature는 순서형 변수입니다. 이 변수 안에서 우리가 상대적인 분류가 가능하기 때문입니다.

- 데이터셋의 Ordinal Feature : Pclass
  • Continuous Features: (연속형 Feature)

    : 어떤 변수가 특정 두 지점, 혹은 최댓값과 최솟값 사이에 어떤 값이든 가질 수 있다면 그 변수는 연속형입니다.

 - 데이터셋의 Continuous Feature : Age

Feature 분석하기

Sex → Categorical Feature

In [7]:
data.groupby(['Sex','Survived'])['Survived'].count().to_frame()
Out[7]:
Survived
Sex Survived
female 0 81
1 233
male 0 468
1 109
In [8]:
f, ax = plt.subplots(1, 2, figsize=(15,6))

data[['Sex', 'Survived']].groupby(['Sex']).mean().plot.bar(ax=ax[0])
ax[0].set_title('Survived vs Sex')

sns.countplot('Sex', hue='Survived', data=data, ax=ax[1])
ax[1].set_title('Sex : Survived vs Dead')

plt.show()

흥미로운 결과 입니다. 남자 탑승객의 수가 여자 탑승객의 수보다 훨씬 많습니다.
그렇지만 여자 생존 탑승객의 수가 남자 생존 탑승객의 수보다 거의 두배 많습니다.
여성의 생존률은 약 75% 정도인데 반해 남자의 생존률은 18~19% 정도입니다.

때문에 성별은 모델링에 매우 중요한 feature일 것입니다.
하지만 이것이 최선일지 다른 feature들을 살펴보겠습니다.

Pclass --> Ordinal Feature

In [9]:
pd.crosstab(data.Pclass, data.Survived, margins = True).style.background_gradient(cmap='summer_r')
Out[9]:
Survived 0 1 All
Pclass
1 80 136 216
2 97 87 184
3 372 119 491
All 549 342 891
In [10]:
f, ax = plt.subplots(1, 2, figsize= (15,6))

data['Pclass'].value_counts().plot.bar(color=['#CD7F32', '#FFDF00', '#D3D3DE'], ax=ax[0])
ax[0].set_title('Number of Passengers by Pcass')
ax[0].set_ylabel('')

sns.countplot('Pclass', hue='Survived', data=data, ax=ax[1])
ax[1].set_title('Plcass : Survived vs Dead.')
Out[10]:
Text(0.5, 1.0, 'Plcass : Survived vs Dead.')

돈으로 모든것을 살 수 없다고 흔히들 말하지만 Pclass 1 의 생존자가 구조 시에 매우 우선 순위에 있었던 것 같습니다.
Pclass 3의 탑승객 수가 훨씬 많았지만, 생존자 비율은 25% 정도로 매우 낮습니다.

Pclass 1의 생존률은 63%, Pclass 2의 생존률은 48% 정도입니다. 결국, 돈과 지위가 중요한 요소로 작용한 듯 합니다.

다른 흥미로운 점을 찾기 위해 더 들어가보겠습니다. 이번에는 Sex와 Pclass를 함께 두고 생존률을 체크해보겠습니다.

In [11]:
pd.crosstab([data.Sex, data.Survived], data.Pclass, margins = True).style.background_gradient(cmap='summer_r')
Out[11]:
Pclass 1 2 3 All
Sex Survived
female 0 3 6 72 81
1 91 70 72 233
male 0 77 91 300 468
1 45 17 47 109
All 216 184 491 891
In [12]:
sns.factorplot('Pclass', 'Survived', hue='Sex', data=data)

plt.show()

이번 케이스에서는 Categorical Value를 쉽게 보기 위해 Factor Plot을 사용했습니다.

CrossTab과 FactorPlot을 보면 Pclass 1 여성 탑승객의 생존률이 95~96% 가량으로 사망자는 3명 정도만 있습니다.

그리고 Pclass와 무관하게, 여성이 구조에 있어서 우선 순위에 있었습니다. 남성의 경우 Pclass 1라도 생존률은 매우 낮습니다.

Pclass 또한 중요한 feature 로 보입니다. 다른 feature를 또 분석해보겠습니다.

Age → Continuous Feature

In [13]:
print('Oldest Passenger was of: ', data['Age'].max(),'Years')
print('Youngest Passeger was of: ', data['Age'].min(),'Years')
print('Average Age on the ship: ', data['Age'].mean(), 'Years')
Oldest Passenger was of:  80.0 Years
Youngest Passeger was of:  0.42 Years
Average Age on the ship:  29.69911764705882 Years
In [14]:
f, ax = plt.subplots(1, 2, figsize = (15,6))

sns.violinplot('Pclass', 'Age', hue='Survived', data=data,split = True, ax=ax[0])
ax[0].set_title('Pclass and Age vs Survived')
ax[0].set_yticks(range(0,110,10))

sns.violinplot('Sex', 'Age', hue='Survived', data=data, split = True,  ax=ax[1])
ax[1].set_title('Sex and Age vs Survived')
ax[1].set_yticks(range(0,110,10))

plt.show()

관찰결과 :

1) Pclass 등급이 낮아짐(1 to 3)에 따라 어린이의 수는 증가하고, 10세 이하의 탑승객 수는 Pclass 수와 관계 없이 좋아보입니다.

2) 20-50세 사이의 Pclass 1 탑승객 생존률은 높고, 여성의 경우에는 더욱 높습니다.

3) 남성은 연령이 증가할수록 생존 확률이 줄어듭니다.

앞에서 본 것처럼, Age Feature는 177개의 Null 값을 가지고 있습니다.
이 값들을 데이터 셋의 평균 값으로 대체할 수 있습니다.

하지만 사람들의 연령은 많고 다양합니다. 우리는 자칫 4세 아이의 연령에게 평균 연령 29세를 부여할 수도 있습니다.
승객이 어떤 연령대에 속했는지 알 수 있는 방법이 없을까요?

우리는 이를 위해 Name Feature를 체크해볼 수 있습니다. Name을 보면 Mr와 Mrs 와 같은 salutation이 있습니다.
그렇기 때문에 Mr와 Mrs 의 평균 값을 각각의 그룹에 부여할 수 있습니다.

Name을 통해 Feature를 추출할 수 있습니다.

In [15]:
data['Initial'] = 0
data['Initial'] = data.Name.str.extract('([A-aZ-z]+)\.') # salutation을 추출합니다.

정규표현식 ( [A-Za-z]+). 를 사용했습니다. 이 정규표현식은 A-Z 또는 a-z 사이의 문자열과 그 뒤에 있는 .(dot)을 찾아냅니다.
이것으로 Name에서 Salutation을 추출했습니다.

In [16]:
pd.crosstab(data.Initial, data.Sex).T.style.background_gradient(cmap='summer_r') # 성별에 따른 Initial 체크
Out[16]:
Initial Capt Col Countess Don Dr Jonkheer Lady Major Master Miss Mlle Mme Mr Mrs Ms Rev Sir
Sex
female 0 0 1 0 1 0 1 0 0 182 2 1 0 125 1 0 0
male 1 2 0 1 6 1 0 2 40 0 0 0 517 0 0 6 1

Miss를 나타내는 Mlle, Mme와 같은 잘못 적힌 Initial 이 있습니다. 이 값들을 Miss 등의 다른 값들로 대체하겠습니다.

In [17]:
data['Initial'].replace(['Mlle','Mme','Ms','Dr','Major','Lady','Countess','Jonkheer','Col','Rev','Capt', 'Sir','Don'],
                                  ['Miss','Miss','Miss','Mr','Mr','Mrs','Mrs','Other','Other','Other','Mr','Mr','Mr'], inplace=True)
In [18]:
data.groupby('Initial')['Age'].mean() # Initial 에 따른 평균연령 체크
Out[18]:
Initial
Master     4.574167
Miss      21.860000
Mr        32.739609
Mrs       35.981818
Other     45.888889
Name: Age, dtype: float64

연령 NaN 채우기

In [19]:
## 평균의 올림 값들로 NaN 값에 할당
data.loc[(data.Age.isnull()) & (data.Initial == 'Mr') , 'Age'] = 33
data.loc[(data.Age.isnull()) & (data.Initial == 'Mrs'), 'Age'] = 36
data.loc[(data.Age.isnull()) & (data.Initial == 'Master'), 'Age'] = 5
data.loc[(data.Age.isnull()) & (data.Initial == 'Miss'), 'Age'] = 22
data.loc[(data.Age.isnull()) & (data.Initial == 'Other'), 'Age'] = 46
In [20]:
data.Age.isnull().any() # Null 값들이 완전히 제거되었습니다.
Out[20]:
False
In [21]:
f, ax = plt.subplots(1, 2, figsize=(15, 6))

data[data['Survived']==0].Age.plot.hist(ax=ax[0], bins=20, edgecolor= 'black', color ='red')
ax[0].set_title('Survived = 0')
x1 = list(range(0,85,5))
ax[0].set_xticks(x1)

data[data['Survived']==1].Age.plot.hist(ax=ax[1], bins=20, edgecolor = 'black', color='green')
ax[1].set_title('Survived = 1')
x2 = list(range(0,85,5))
ax[1].set_xticks(x2)

plt.show()

관찰결과 :

1) 5세 이하의 아이들은 많이 생존했습니다. (여성과 아이 우선)

2) 가장 고연령 탑승객도 생존했습니다. (80세)

3) 가장 많은 수의 사망자가 있는 연령 그룹은 30-40세 입니다.

In [22]:
sns.factorplot('Pclass', 'Survived', col = 'Initial', data=data)
plt.show()

각 클래스와 관계없이 여성과 아이가 우선되었다는게 명확해 보입니다.

Embarked → Categorical Value

In [23]:
pd.crosstab([data.Embarked, data.Pclass], [data.Sex, data.Survived], margins =True).style.background_gradient(cmap='summer_r')
Out[23]:
Sex female male All
Survived 0 1 0 1
Embarked Pclass
C 1 1 42 25 17 85
2 0 7 8 2 17
3 8 15 33 10 66
Q 1 0 1 1 0 2
2 0 2 1 0 3
3 9 24 36 3 72
S 1 2 46 51 28 127
2 6 61 82 15 164
3 55 33 231 34 353
All 81 231 468 109 889

탑승 항구에 따른 생존확률

In [24]:
sns.factorplot('Embarked', 'Survived', data=data)
fig = plt.gcf()
fig.set_size_inches(5, 3)
plt.show()

C항구의 생존률이 약 0.55 정도로 가장 높고, S항구가 가장 낮습니다.

In [25]:
f, ax = plt.subplots(2, 2, figsize=(15, 12))

sns.countplot('Embarked', data=data, ax=ax[0,0])
ax[0,0].set_title('No. of Passengers Boarded')

sns.countplot('Embarked', hue='Sex', data=data, ax=ax[0,1])
ax[0,1].set_title('Male-Female Split for Embarked')

sns.countplot('Embarked', hue='Survived', data=data, ax=ax[1,0])
ax[1,0].set_title('Embarked vs Survived')

sns.countplot('Embarked', hue = 'Pclass', data=data, ax=ax[1,1])
ax[1,1].set_title('Embarked vs Pclass')

plt.subplots_adjust(wspace=0.2, hspace=0.2)
plt.show()

관찰결과 :

1) S에서 가장 많은 승객이 탑승했습니다. 그리고 그 탑승객들의 대부분은 Pclass 3입니다.

2) C에서 탑승한 승객은 생존률이 높아 운이 좋아보입니다. Pclass 1과 2의 승객이기 때문일거 같습니다.

3) S항구에서 다수의 부유한 사람들이 탑승한 것 같습니다. 이 그룹의 생존률은 낮은데, 약 81%가 생존하지 못한 Pclass 3의 승객이기 때문입니다.

4) Q항구에서 탑승한 승객의 95% 가량이 Pclass 3이다.

In [26]:
sns.factorplot('Pclass', 'Survived', hue = 'Sex', col = 'Embarked', data=data)
plt.show()

관찰결과 :

1) Pclass 1과 Pclass2 여성의 생존률은 Pclass와 관계 없이 거의 1입니다.

2) S 항구에서 탑승한 Pclass 3의 탑승객은 매우 운이 없는 것 같습니다. 남성과 여성의 생존률이 모두 낮습니다. (돈이 중요한 요소입니다.)

3) Q 항구에서 탑승한 남성이 제일 불운해 보입니다. 그들 대부분이 Pclass 3 탑승객이기 때문입니다.

Embarked 의 NaN 채우기

대부분의 탑승객이 S에서 탑승했기 때문에 S로 채워주겠습니다.

In [27]:
data['Embarked'].fillna('S', inplace = True)
In [28]:
data['Embarked'].isnull().any() # NaN이 모두 제거되었습니다.
Out[28]:
False

SibSp → Discrete Feature

이 Feature는 탑승객이 혼자인지 아니면 가족과 함께 탔는지를 나타냅니다.

Sibling → 형제자매, 의붓형제자매

Spouse → 배우자

In [29]:
pd.crosstab([data.SibSp], data.Survived).style.background_gradient(cmap='summer_r')
Out[29]:
Survived 0 1
SibSp
0 398 210
1 97 112
2 15 13
3 12 4
4 15 3
5 5 0
8 7 0
In [30]:
f, ax = plt.subplots(1, 2, figsize=(15,6))

sns.barplot('SibSp', 'Survived', data=data, ax=ax[0])
ax[0].set_title('SibSp vs Survived')

sns.factorplot('SibSp', 'Survived', data=data, ax=ax[1])
ax[1].set_title('SibSp vs Survived')

plt.close(2)
plt.show()
In [31]:
pd.crosstab(data.SibSp, data.Pclass).style.background_gradient(cmap='summer_r')
Out[31]:
Pclass 1 2 3
SibSp
0 137 120 351
1 71 55 83
2 5 8 15
3 3 1 12
4 0 0 18
5 0 0 5
8 0 0 7

관찰결과 :

barplot과 factorplot을 통해 봤을 때, 승객이 혼자 탑승했을 때 생존률이 34.5% 정도입니다.
그래프의 기울기는 형제자매, 배우자의 수가 증가하면 그래프의 기울기는 감소합니다. 이해가 가는 결과 입니다.
만약, 가족과 함께 탔다면 내가 생존하기 전에 가족을 살리려고 할 것이기 때문입니다.
하지만 놀랍게도 가족의 수가 5-8명인 경우에는 생존률이 0%입니다. 이유는 아마 Pclass 때문일까요?

그 원인은 Pclass입니다. crosstab을 보면 SibSp > 3 인 경우 모두 Pclass 3에 속했습니다.
Pclass 3의 3명 초과 가족들은 모두 사망한 것이 분명합니다.

Parch

In [32]:
pd.crosstab(data.Parch, data.Pclass).style.background_gradient(cmap='summer_r')
Out[32]:
Pclass 1 2 3
Parch
0 163 134 381
1 31 32 55
2 21 16 43
3 0 2 3
4 1 0 3
5 0 0 5
6 0 0 1

crosstab을 통해 또 구성원이 많은 가족들은 Pclass3에 속함을 알 수 있습니다.

In [33]:
f, ax = plt.subplots(1, 2, figsize=(15,6))

sns.barplot('Parch', 'Survived', data=data, ax=ax[0])
ax[0].set_title('Parch vs Survived')

sns.factorplot('Parch', 'Survived', data=data, ax=ax[1])
ax[1].set_title('Parch vs Survived')

plt.close(2)
plt.show()

관찰결과 :

비슷한 결과가 나왔습니다. 부모님, 아이와 함꼐 탑승한 승객들의 생존 확률은 높았습니다.
하지만 그 수가 증가할 수록 생존률은 감소했습니다.

1-3명의 부모님, 아이와 탑승한 승객의 생존률이 좋았습니다.
혼자 탑승하는 경우, 생존하기가 어려우며, 가족이 4명이상 탑승한 경우에도 생존률은 감소했습니다.

Fare --> Continuous Feature

In [34]:
print('Highest Fare was: ', data['Fare'].max())
print('Lowest Fare was: ', data['Fare'].min())
print('Average Fare was: ', data['Fare'].mean())
Highest Fare was:  512.3292
Lowest Fare was:  0.0
Average Fare was:  32.2042079685746

가장 낮은 요금은 0원입니다.

In [35]:
f, ax = plt.subplots(1,3, figsize=(15,5))

sns.distplot(data[data['Pclass']==1].Fare, ax=ax[0])
ax[0].set_title('Fare in Pclass 1')

sns.distplot(data[data['Pclass']==2].Fare, ax=ax[1])
ax[1].set_title('Fare in Pclass 2')

sns.distplot(data[data['Pclass']==3].Fare, ax=ax[2])
ax[2].set_title('Fare in Pclass 3')
Out[35]:
Text(0.5, 1.0, 'Fare in Pclass 3')

Pclass 1 탑승객의 경우 요금 분포가 넓게 퍼져있습니다. 그리고 Pclass의 등급이 낮아질 때마다 분포는 좁아집니다. 이 변수는 연속형이기 때문에, 우리는 binning을 통해 이산형 값들로 변환해줄 것입니다.

모든 Feature들의 관찰 결과 요약 :

  • Sex : 여성의 생존확률이 남성에 비해 높았습니다.
  • Pclass :1st 클래스 탑승객의 생존률이 높은 경향을 보였습니다. Pclass 3의 생존률은 매우 낮았습니다.
    여성의 경우 Pclass 1 탑승객의 생존률은 거의 1이었고, Pclass 2의 경우에도 높았습니다. 결국 생존에는 돈이 중요했습니다.
  • Age : 5-10세보다 적은 어린이들의 생존확률이 높았습니다. 15-35세의 탑승객들은 많이 사망했습니다.
  • Embarked : 흥미로운 Feature 였습니다. 다수의 Pclass 1 탑승객이 S에서 제일 많았지만, C에서 탑승한 승객의 생존률이 더 높았습니다.
    Q에서 탑승한 승객은 거의 다 Pclass 3 에 속했습니다.
  • Parch + SibSp : 1-2명의 형제자매, 1-3명의 가족, 자녀와 함께 탑승한 경우가 혼자 탑승 또는 많은 수의 가족과 함께 탑승한 경우보다 훨씬 생존률이 높았습니다.

Correlation Between The Features

In [36]:
sns.heatmap(data.corr(), annot=True, cmap='RdYlGn',linewidths= 0.2) ## data.corr() --> 상관관계 행렬
fig = plt.gcf()
fig.set_size_inches(10, 8)
plt.show()

Heatmap의 해석

먼저 알아야 할 것은, 숫자데이터가 아닌 문자열 데이터의 상관관계는 구할 수 없다는 것입니다.
plot을 이해하기전에 상관관계가 무엇인지 보겠습니다.

  • 양의 상관관계(Positive Correlation) :
    feature A의 증가하는데 feature B가 증가한다면, 두 feature는 양의 상관관계입니다. 1 은 완전 양의 상관관계를 의미합니다.
  • 음의 상관관계(Negative Correlation) :
    feature A의 감소하는데 feature B가 증가한다면, 두 feature는 음의 상관관계입니다. -1 은 완전 음의 상관관계를 의미합니다.

두 Feature가 상당히 높은, 혹은 완전한 양의 상관관계를 가지고 있다고 하면, 한 feature값이 증가하면 다른 feature의 값도 증가합니다.
이것은 두 feature가 매우 비슷한 정보를 가지고 있으며, 그 정보간의 분산이 거의 없다는 것을 의미합니다. 이를 다중공선성(MultiColinearity)이라 합니다.

이 변수들이 redundant할 때, 우리는 그 변수를 둘 다 사용해야할까요?
모델을 만들거나 학습시킬 때, 학습시간을 줄이는 등 다른 이점을 위해 redudant한 feature는 제거되도록 해야합니다.

위의 Heatmap을 보았을 때, feature들간의 상관관계는 그렇게 높아보이지 않습니다.
가장 높은 상관관계를 지닌 두 변수는 SibSp와 Parch로 상관계수는 0.41입니다. 그렇기 때문에 모든 feature를 사용하도록 하겠습니다.

Part 2 : Feature Engineering and Data Cleansing

Feature Engineering이 무엇일까요?

feature들이 있는 dataset이 주어졌을 때, 모든 feature가 중요하진 않습니다.
제거되어야 할 redundant한 Feature가 있을 수 있습니다. 그리고 다른 feature의 관찰, 정보 추출을 통해 새로운 feature를 만들 수도 있습니다.

Name으로부터 Initial 을 만들어낸 것도 한 예입니다. 새로운 feature를 만들거나 제거해야할 Feature가 있는지 살펴보겠습니다.
그리고 예측 모델에 적합한 형태로 feature들을 변환하겠습니다.

Age_band

Problem with Age Feature:

먼저 언급했듯이, Age는 continuous feature 입니다. continuous feature의 경우, 머신러닝모델에 있어 문제가 하나 있습니다.

가령, 운동선수들을 성별로 그룹을 나눈다고 할 때, 우리는 쉽게 남성, 여셩으로 나눌 수 있습니다.

연령으로 그룹을 나눈다고 할때, 어떻게 나눌수 있을까요? 만약 30명의 사람에 30개의 연령값이 있다고 하겠습니다. 이런 경우가 문제가 됩니다.

우리는 contiunous 값을 category값으로 Binning이나 Normalization을 통해 변환해야합니다. 이번에는 binning을 통해 연령에 하나의 값을 할당하겠습니다.

최대 연령이 80세이기 떄문에, 0부터 80세까지의 연령을 5개의 bin으로 나누겠습니다. 80/5 = 16 이기 때문에, bin하나의 사이즈는 16입니다.

In [37]:
data['Age_band'] = 0 

data.loc[data['Age'] <= 16, 'Age_band'] = 0
data.loc[ (data['Age'] > 16) & (data['Age'] <=32), 'Age_band'] = 1
data.loc[ (data['Age'] > 32) & (data['Age'] <=48), 'Age_band'] = 2
data.loc[ (data['Age'] > 48) & (data['Age'] <=64), 'Age_band'] = 3
data.loc[ data['Age'] > 64, 'Age_band'] = 4

data.head(2)
Out[37]:
PassengerId Survived Pclass Name Sex Age SibSp Parch Ticket Fare Cabin Embarked Initial Age_band
0 1 0 3 Braund, Mr. Owen Harris male 22.0 1 0 A/5 21171 7.2500 NaN S Mr 1
1 2 1 1 Cumings, Mrs. John Bradley (Florence Briggs Th... female 38.0 1 0 PC 17599 71.2833 C85 C Mrs 2
In [38]:
data['Age_band'].value_counts().to_frame().style.background_gradient(cmap='summer') # 각 연령구간의 탑승객 수 체크
Out[38]:
Age_band
1 382
2 325
0 104
3 69
4 11
In [39]:
sns.factorplot('Age_band', 'Survived', data=data, col = 'Pclass')
plt.show()

Pclass와 관계없이 연령이 증가할수록 생존률이 낮아집니다.

Family_Size 와 Alone

이번에는 "Family_Size"와 "Alone" Feature를 만들어 분석하겠습니다.
이 Feature들은 Parch와 SibSp의 요약입니다. 가족의 수와 생존률의 관계를 체크하기 위한 통합된 데이터를 얻을 수 있습니다.
Alone은 승객이 혼자인지 아닌지를 나타냅니다.

In [40]:
data['Family_Size'] = 0 
data['Family_Size'] = data['Parch'] + data['SibSp'] # Family_Size 
data['Alone'] = 0
data.loc [data.Family_Size ==0, 'Alone'] = 1 # Alone
In [41]:
f, ax = plt.subplots(1, 2, figsize=(15,5))

sns.factorplot('Family_Size', 'Survived', data=data, ax=ax[0])
ax[0].set_title('Family_Size vs Survived')

sns.factorplot('Alone', 'Survived', data=data, ax=ax[1])
ax[1].set_title('Alone vs Survived')

plt.close(2)
plt.close(3)
plt.show()

Family_Size = 0 은 탑승객이 혼자임을 의미합니다. 혼자일 때, 생존률은 매우 낮습니다.
가족 수가 4명 이상일 때도 생존률은 감소합니다. 때문에 모델링에 중요한 Feature인 것 같습니다. 조금 더 분석해보겠습니다.

In [42]:
sns.factorplot('Alone', 'Survived', data=data, hue='Sex', col = 'Pclass')
plt.show()

Pclass와 무관하게 혼자 탑승한 경우는 위험합니다. 하지만 예외적으로 Pclass 3 여성 탑승객의 생존률은 가족과 함께 탑승하지 않은 경우보다 오히려 높습니다.

Fare_Range

Fare는 연속형 Feature이기 때문에, 이것을 서수형 값(Ordinal value)로 변환하겠습니다. 이 작업에pandas.qcut을 사용할 것입니다.

qcut 은 우리가 입력한 구간의 수(bin)에 따라 데이터 값을 분할 해줍니다. 가령 우리가 5개 구간을 입력하면, 5개의 구간으로 데이터 수를 균일하게 분할합니다.

In [43]:
data['Fare_Range'] = pd.qcut(data['Fare'], 4)
data.groupby(['Fare_Range'])['Survived'].mean().to_frame().style.background_gradient(cmap='summer_r')
Out[43]:
Survived
Fare_Range
(-0.001, 7.91] 0.197309
(7.91, 14.454] 0.303571
(14.454, 31.0] 0.454955
(31.0, 512.329] 0.581081

위에서 얘기한 것처럼, Fare_Range가 증가할 수록 생존률도 증가합니다.

하지만 우리는 Fare_Range를 그대로 사용할 수 없습니다. Age_Band에서 했던 것과 동일하게 하나의 값으로 변환해주어야 합니다.

In [44]:
data['Fare_cat'] = 0
data.loc[data['Fare'] <= 7.91, 'Fare_cat'] = 0
data.loc[(data['Fare'] > 7.91) & (data['Fare']<=14.454), 'Fare_cat'] = 1
data.loc[(data['Fare'] > 14.454) & (data['Fare']<=31), 'Fare_cat'] = 2
data.loc[(data['Fare'] > 31) & (data['Fare']<=513), 'Fare_cat'] = 3
In [45]:
sns.factorplot('Fare_cat', 'Survived', data=data, hue='Sex')
plt.show()

Fare_cat 이 증가할수록 생존률이 증가합니다. 이것도 Sex와 함께 모델링에 중요한 Feature가 될 것 같습니다.

문자열 값을 숫자형으로 변환하기

문자열 값을 머신러닝 모델에 사용할 수 없기 때문에, Sex, Embarked 등의 feature를 숫자값으로 변환해주어야 합니다.

In [46]:
data['Sex'].replace(['male','female'], [0, 1], inplace=True)
data['Embarked'].replace(['S','C','Q'],[0,1,2], inplace=True)
data['Initial'].replace(['Mr','Mrs','Miss','Master','Other'], [0,1,2,3,4], inplace=True)

필요하지 않은 Feature를 drop하기

Name → Categorical value로 변환할 수 없으므로 필요 없습니다.

Age → Age_band가 있기 때문에 필요 없습니다.

Ticket → 카테고리화 될 수 없는 무작위 문자열입니다.

Fare → Fare_cat이 있기 때문에 필요없습니다.

Cabin → NaN 값이 너무 많고, 많은 승객에 따라 cabin 값이 많습니다. 그렇기 때문에 필요하지 않습니다.

Fare_Range → Fare_cat이 있어서 필요 없습니다.

PassengerId → 카테고리화 될 수 없습니다.

In [47]:
data.drop(['Name', 'Age', 'Ticket', 'Fare', 'Cabin', 'Fare_Range', 'PassengerId'], axis=1, inplace=True)

sns.heatmap(data.corr(), annot=True, cmap='RdYlGn', linewidths=0.2, annot_kws={'size' : 20})
fig = plt.gcf()
fig.set_size_inches(15, 15)
plt.xticks(fontsize=14)
plt.yticks(fontsize=14)
plt.show()

위의 Correlation plot에서 몇몇 양의 상관관계를 가진 feature들을 볼 수 있습니다.
SibSp, Family_Size와 Parch 가 양의 상관관계를 가지고, Alone과 Family_Size는 음의 상관관계를 가지고 있습니다.

Part 3: Predictive Modeling

EDA를 통해 인사이트를 얻었스빈다. 하지만 그것만으로는 승객의 생존 여부를 정확히 예측할 수 없습니다. 우리는 몇몇 훌륭한 분류 알고리즘을 사용하여 승객의 생존여부를 예측할 것입니다. 아래의 알고리즘을 모델을 만드는데 사용할 것입니다.

1) Logistics Regression

2) Support Vector Machines (Linear and radial)

3) Random Foresr

4) K-Nearesr Neighbors

5) Naive Bayes

6) Decision Tree

7) Logistic Regression

In [48]:
## 필요한 머신러닝 패키지들을 불러옵니다
from sklearn.linear_model import LogisticRegression # logistic regression
from sklearn import svm # support vector machine
from sklearn.ensemble import RandomForestClassifier #Random Forest
from sklearn.neighbors import KNeighborsClassifier # KNN
from sklearn.naive_bayes import GaussianNB # Naive Bayes
from sklearn.tree import DecisionTreeClassifier # Decision Tree

from sklearn.model_selection import train_test_split # training and testing data split 
from sklearn import metrics # accuracy measure
from sklearn.metrics import confusion_matrix # confusion matrix
In [49]:
train, test = train_test_split(data, test_size = 0.3, random_state = 0, stratify=data['Survived'])
train_X = train[train.columns[1:]]
train_Y = train[train.columns[:1]]
test_X = test[test.columns[1:]]
test_Y = test[test.columns[:1]]
X = data[data.columns[1:]]
Y = data['Survived']

Radial Support Vector Machines(rbf-SVM)

In [50]:
model = svm.SVC(kernel = 'rbf', C = 1, gamma = 0.1)
model.fit(train_X, train_Y)
prediction1 = model.predict(test_X)
print('Accuracy for rbf SVM is ', metrics.accuracy_score(prediction1, test_Y))
Accuracy for rbf SVM is  0.835820895522388

Linear Support Vector Machines(linear-SVM)

In [51]:
model=svm.SVC(kernel='linear',C=0.1,gamma=0.1)
model.fit(train_X,train_Y)
prediction2=model.predict(test_X)
print('Accuracy for linear SVM is',metrics.accuracy_score(prediction2,test_Y))
Accuracy for linear SVM is 0.8171641791044776

Logistic Regression

In [52]:
model = LogisticRegression()
model.fit(train_X, train_Y)
prediction3 = model.predict(test_X)
print('Accuracy of the Logistic Regression is ', metrics.accuracy_score(prediction3, test_Y))
Accuracy of the Logistic Regression is  0.8171641791044776

Decision Tree

In [53]:
model = DecisionTreeClassifier()
model.fit(train_X, train_Y)
prediction4 = model.predict(test_X)
print('Accuracy ofthe Decision Tree is ', metrics.accuracy_score(prediction4, test_Y))
Accuracy ofthe Decision Tree is  0.8022388059701493

K-Nearest Neighbours(KNN)

In [54]:
model = KNeighborsClassifier()
model.fit(train_X, train_Y)
prediction5 = model.predict(test_X)
print('Accuracy of the KNN is ', metrics.accuracy_score(prediction5, test_Y))
Accuracy of the KNN is  0.832089552238806

KNN 모델의 정확도는 n_neighbors 값을 조절하면 변화합니다. 기본값은 5입니다. n_neighbor의 여러 값에 따른 정확도를 체크해보겠습니다.

In [55]:
a_index = list(range(1,11))
a = pd.Series()
x = [0, 1, 2, 3, 4, 5, 6, 7, 8, 9, 10]
for i in list(range(1,11)):
    model = KNeighborsClassifier(n_neighbors=i)
    model.fit(train_X, train_Y)
    prediction = model.predict(test_X)
    a = a.append(pd.Series(metrics.accuracy_score(prediction, test_Y)))
plt.plot(a_index, a)
plt.xticks(x)
fig = plt.gcf()
fig.set_size_inches(12, 6)
plt.show()
print('Accuracies for different values of n are : ', a.values, 'with the max values as', a.values.max())
Accuracies for different values of n are :  [0.75746269 0.79104478 0.80970149 0.80223881 0.83208955 0.81716418
 0.82835821 0.83208955 0.8358209  0.83208955] with the max values as 0.835820895522388

Gaussian Naive Bayes

In [56]:
model = GaussianNB()
model.fit(train_X, train_Y)
prediction6 = model.predict(test_X)
print('The accuracy of the Naive Bayes is ', metrics.accuracy_score(prediction6, test_Y))
The accuracy of the Naive Bayes is  0.8134328358208955

Random Forests

In [57]:
model = RandomForestClassifier(n_estimators=100)
model.fit(train_X, train_Y)
prediction7 = model.predict(test_X)
print('The accuracy of the Random Forests is ', metrics.accuracy_score(prediction7, test_Y))
The accuracy of the Random Forests is  0.8208955223880597

모델의 정확도가 분류기의 robustness를 결정하는 유일한 요소는 아닙니다.
분류기가 훈련 데이터로 학습하고, 테스트 데이터로 테스트 했을 때, 정확도가 90%였다고 합시다.

분류기의 정확도가 매우 높은 것처럼 보입니다. 하지만 다른 테스트 셋에 대해서도 90%가 나올까요?
그렇지 않습니다. 분류기가 학습하기 위해 어떤 사건을 사용할지 결정할 수 없기 때문입니다.
훈련 데이터와 테스트 데이터가 변하면, 정확도도 변하게 뒵니다. 이것을 Model Variance라고 합니다.

이런 점을 극복하고 일반화된 모델을 얻기 위해 우리는 Cross Validation(교차검증)을 사용합니다.

Cross Validation(교차검증)

많은 경우에, 데이터는 불균형합니다. 많은 수의 class 1 객체들이 존재하지만 다른 class 객체들은 적을 수 있습니다.
그렇기 때문에 데이터 셋 각각의 모든 객체에 알고리즘을 훈련시키고 테스트 해야합니다.
그 때, 우리는 각 데이터 셋에서 나온 정확도들의 평균을 이용할 수 있습니다.

1) K-Fold Cross Validation에서는 먼저 데이터 셋을 K개의 서브 데이터셋으로 나눕니다.

2) 우리가 데이터셋을 5개로 나눴다고 하면, 1개의 데이터셋은 테스트용으로 나머지 4개는 훈련용으로 사용합니다.

3) 각 수행시마다 테스트 셋을 바꿔주고, 다른 셋에 대해 알고리즘을 훈련시키면서 이 프로세스를 계속해나갑니다.
정확도와 오차는 평균화되어 알고리즘의 평균 정확도를 얻을 수 있습니다.

이것은 K-Fold Cross Validation이라고 합니다.

4) 일부 데이터 셋에서는 underfit(과소적합), 다른 데이터셋에는 overfit(과대적합)될 수 있습니다.
때문에 cross validation을 통해서, 우리는 일반화된 모델을 얻을 수 있습니다.

In [58]:
from sklearn.model_selection import KFold # K-Fold Cross Validation 
from sklearn.model_selection import cross_val_score # 점수 평가
from sklearn.model_selection import cross_val_predict # 예측

kfold = KFold(n_splits = 10, random_state = 22) # k = 10 , 데이터셋을  동일 크기의 10개의 서브셋으로 나눕니다.
xyz = []
accuracy = []
std = []
classifiers = ['Linear Svm', 'Radial Svm', 'Logistic Regression', 'KNN', 'Decision Tree',
              'Naive Bayes', 'Random Forest']
models = [svm.SVC(kernel = 'linear'), svm.SVC(kernel = 'rbf'), LogisticRegression(), 
                 KNeighborsClassifier(n_neighbors=9), DecisionTreeClassifier(), GaussianNB(),
                 RandomForestClassifier(n_estimators=100)]
for i in models :
    model = i 
    cv_result = cross_val_score(model, X, Y, cv = kfold, scoring = 'accuracy')
    cv_result = cv_result 
    xyz.append(cv_result.mean())
    std.append(cv_result.std())
    accuracy.append(cv_result)

new_models_dataframe2 = pd.DataFrame({'CV Mean' : xyz, 'Std' : std}, index=classifiers)
new_models_dataframe2
Out[58]:
CV Mean Std
Linear Svm 0.793471 0.047797
Radial Svm 0.828290 0.034427
Logistic Regression 0.805843 0.021861
KNN 0.813783 0.041210
Decision Tree 0.813708 0.030123
Naive Bayes 0.801386 0.028999
Random Forest 0.812597 0.027789
In [59]:
plt.subplots(figsize=(12,6))
box = pd.DataFrame(accuracy, index = [classifiers])
box.T.boxplot()
Out[59]:
<matplotlib.axes._subplots.AxesSubplot at 0x1a27d11f60>
In [60]:
new_models_dataframe2['CV Mean'].plot.barh(width = 0.8)
plt.title('Average CV Mean Accuracy')
fig = plt.gcf()
fig.set_size_inches(8,5)
plt.show()

분류 정확도는 데이터 불균형으로 인해 잘못된 결론을 낼 수 있습니다. 혼동행렬을 이용해 요약된 결과를 얻을 수 있는데,
이 혼동행렬은 모델이 어디에서 잘못되었는지, 어떤 클래스를 모델이 잘못 예측했는지를 보여줍니다.

Confusion Matrix

혼동행렬은 분류기에 의해 나온 정확한, 또는 부정확한 분류의 개수를 보여줍니다.

In [61]:
f, ax = plt.subplots(3, 3, figsize=(12,10))

y_pred = cross_val_predict(svm.SVC(kernel='rbf'), X, Y, cv=10)
sns.heatmap(confusion_matrix(Y,y_pred), ax=ax[0,0], annot=True, fmt = '2.0f')
ax[0,0].set_title('Matrix for rbf-SVM')

y_pred = cross_val_predict(svm.SVC(kernel='linear'), X, Y, cv=10)
sns.heatmap(confusion_matrix(Y,y_pred), ax=ax[0,1], annot=True, fmt = '2.0f')
ax[0,1].set_title('Matrix for Linear-SVM')

y_pred = cross_val_predict(KNeighborsClassifier(n_neighbors=9), X, Y, cv=10)
sns.heatmap(confusion_matrix(Y,y_pred), ax=ax[0,2], annot=True, fmt = '2.0f')
ax[0,2].set_title('Matrix for KNN')

y_pred = cross_val_predict(RandomForestClassifier(n_estimators=100), X, Y, cv=10)
sns.heatmap(confusion_matrix(Y,y_pred), ax=ax[1,0], annot=True, fmt = '2.0f')
ax[1,0].set_title('Matrix for Random-Forests')

y_pred = cross_val_predict(LogisticRegression(), X, Y, cv=10)
sns.heatmap(confusion_matrix(Y,y_pred), ax=ax[1,1], annot=True, fmt = '2.0f')
ax[1,1].set_title('Matrix for Logistics Regression')

y_pred = cross_val_predict(DecisionTreeClassifier(), X, Y, cv=10)
sns.heatmap(confusion_matrix(Y,y_pred), ax=ax[1,2], annot=True, fmt = '2.0f')
ax[1,2].set_title('Matrix for Decision Tree')

y_pred = cross_val_predict(GaussianNB(), X, Y, cv=10)
sns.heatmap(confusion_matrix(Y,y_pred), ax=ax[2,0], annot=True, fmt = '2.0f')
ax[2,0].set_title('Matrix for Naive Bayes')

plt.subplots_adjust(hspace=0.2, wspace = 0.2)
plt.show()

혼동행렬의 해석

왼상단-우하단 대각선은 각 객체에 대해 정확한 예측의수, 우상단-좌하단 대각선은 잘못된 예측의 수를 말합니다.
첫번째 plot의 rbf-SVM을 보겠습니다.

1) 정확한 예측의 수는 491(사망) + 247(생존) 으로 평균 CV 정확도(mean CV accuracy)는 (491+247)/891 = 82.8% 입니다.

2) Errors(오류) --> 58명의 사망자들이 생존자로 분류되었고, 95명의 생존자들이 사망자로 분류되었습니다.
죽은 사람을 살아있다고 예측하면서 더 많은 실수가 발생했습니다.

각각의 행렬을 보면 rbf-SVM이 사망자를 예측하는데 보다 정확하다고 볼 수 있습니다.
반면, Naive Bayes는 생존자를 예측하는데 보다 정확했습니다.

하이퍼 파라미터 튜닝

머신러닝 모델은 블랙박스 같습니다. 이 블랙박스에는 기본 파라미터 값이 있는데, 우리는 이것을 조절함으로써 더 좋은 모델을 얻을 수 있습니다.
SVM 모델의 C와 gamma같이 다른 분류기에는 다른 파라미터들이 있는데, 이들을 하이퍼 파라미터라고 합니다.
이 하이퍼 파라미터를 튜닝해서 모델의 학습률을 변경해줄 수 있고 더 좋은 모델을 얻을 수 있습니다. 이것을 하이퍼 파라미터 튜닝이라고 합니다.

좋은 결과를 보였던 2개 분류기(SVM, Random Forest)의 하이퍼파라미터를 튜닝하겠습니다.

SVM

In [62]:
from sklearn.model_selection import GridSearchCV
C=[0.05,0.1,0.2,0.3,0.25,0.4,0.5,0.6,0.7,0.8,0.9,1]
gamma=[0.1,0.2,0.3,0.4,0.5,0.6,0.7,0.8,0.9,1.0]
kernel=['rbf','linear']
hyper={'kernel' : kernel, 'C' : C, 'gamma' : gamma}
gd=GridSearchCV(estimator=svm.SVC(), param_grid=hyper, verbose=True)
gd.fit(X,Y)
print(gd.best_score_)
print(gd.best_estimator_)
Fitting 3 folds for each of 240 candidates, totalling 720 fits
[Parallel(n_jobs=1)]: Using backend SequentialBackend with 1 concurrent workers.
0.8282828282828283
SVC(C=0.5, cache_size=200, class_weight=None, coef0=0.0,
  decision_function_shape='ovr', degree=3, gamma=0.1, kernel='rbf',
  max_iter=-1, probability=False, random_state=None, shrinking=True,
  tol=0.001, verbose=False)
[Parallel(n_jobs=1)]: Done 720 out of 720 | elapsed:    9.3s finished

Random Forests

In [63]:
n_estimators = range(100, 1000, 100)
hyper = { 'n_estimators' : n_estimators }
gd = GridSearchCV(estimator=RandomForestClassifier(random_state=0), param_grid=hyper, verbose = True)
gd.fit(X,Y)
print(gd.best_score_)
print(gd.best_estimator_)
[Parallel(n_jobs=1)]: Using backend SequentialBackend with 1 concurrent workers.
Fitting 3 folds for each of 9 candidates, totalling 27 fits
[Parallel(n_jobs=1)]: Done  27 out of  27 | elapsed:   11.6s finished
0.8170594837261503
RandomForestClassifier(bootstrap=True, class_weight=None, criterion='gini',
            max_depth=None, max_features='auto', max_leaf_nodes=None,
            min_impurity_decrease=0.0, min_impurity_split=None,
            min_samples_leaf=1, min_samples_split=2,
            min_weight_fraction_leaf=0.0, n_estimators=900, n_jobs=None,
            oob_score=False, random_state=0, verbose=0, warm_start=False)

Rbf-SVM의 최고 점수는 C = 0.5, gamma = 0.1 일 때인 82.82%이고, RandomForest는 n_estimators=900일 때인 81.7% 입니다.

Ensembling

앙상블은 모델의 정확도와 성능을 높이기 위한 좋은 방법입니다.
간단한 말로, 하나의 강력한 모델을 만들기 위한 여러 단순한 모델의 조합입니다.

핸드폰을 사기 위해 많은 사람들에게 여러 파라미터에 대해 질문을 했다고 가정합시다.
그 후 우리는 모든 다른 파라미터들을 분석 한 뒤에 한 제품에 대한 강한 판단을 할 수 있을 것입니다.
이것이 모델의 안정성을 향상시켜주는 앙상블입니다. 앙상블은 다음의 방법으로 수행할 수 있습니다.

1) Voting Classifier

2) Bagging

3) Boosting

Voting Classifier

Voting Classifier는 많고 다양한 단순한 학습 모델로부터 예측들을 결합하는 가장 단순한 방법입니다.
예측값은 각 서브모델 예측치의 평균치입니다. 각 서브모델들은 다 다른 유형의 모델입니다.

In [64]:
from sklearn.ensemble import VotingClassifier
ensemble_lin_rbf = VotingClassifier(estimators=[('KNN', KNeighborsClassifier(n_neighbors=10)),
                                                                            ('RBF', svm.SVC(probability=True, kernel = 'rbf', C=0.5, gamma = 0.1)),
                                                                            ('RFor', RandomForestClassifier(n_estimators=900, random_state=0)),
                                                                            ('LR', LogisticRegression(C=0.05)),
                                                                            ('DT', DecisionTreeClassifier(random_state=0)),
                                                                            ('NB', GaussianNB()),
                                                                            ('svm', svm.SVC(kernel='rbf', probability = True)) ],
                                                        voting='soft').fit(train_X, train_Y)
print('The accuracy for ensembled model is: ', ensemble_lin_rbf.score(test_X, test_Y))
cross = cross_val_score(ensemble_lin_rbf, X, Y, cv = 10, scoring = 'accuracy')
print('The cross validated score is ', cross.mean())
The accuracy for ensembled model is:  0.8171641791044776
The cross validated score is  0.8249148791283624

Bagging

배깅은 일반적인 앙상블 방법입니다.
데이터셋의 작은 파티션에 대해 유사한 분류기들을 적용하고, 모든 예측치에 대한 평균을 적용함으로써 작용합니다.
평균화를 통해 분산이 감소됩니다. Voting Classifier와는 달리 배깅은 유사한 분류기를 사용합니다.

Bagged KNN

배깅은 분산이 높은 모델에 가장 잘 작용합니다. 그 예는 Decision Tree나 Random Forests 입니다.
우리는 n_neighbor의 작은 값을 적용하여 KNN을 n_neighbors의 작은 값으로 사용해보겠습니다.

In [65]:
from sklearn.ensemble import BaggingClassifier
model = BaggingClassifier(base_estimator=KNeighborsClassifier(n_neighbors=3), random_state=0, n_estimators=700)
model.fit(train_X, train_Y)
prediction = model.predict(test_X)
print('The accuracy for bagged KNN is : ', metrics.accuracy_score(prediction, test_Y))
result = cross_val_score(model, X, Y, cv = 10, scoring='accuracy')
print('The cross validated score for bagged KNN is: ', result.mean())
The accuracy for bagged KNN is :  0.835820895522388
The cross validated score for bagged KNN is:  0.8148893428668709

Bagged Decision Tree

In [66]:
model = BaggingClassifier(base_estimator=DecisionTreeClassifier(), random_state=0, n_estimators=100)
model.fit(train_X, train_Y)
prediction = model.predict(test_X)
print('The accuracy for bagged Decision Tree is: ', metrics.accuracy_score(prediction, test_Y))
result = cross_val_score(model, X, Y, cv = 10, scoring = 'accuracy')
print('The cross validated score for bagged Decision Tree is: ', result.mean())
The accuracy for bagged Decision Tree is:  0.8246268656716418
The cross validated score for bagged Decision Tree is:  0.8204826353421859

Boosting

부스팅은 분류기의 순차적인 학습을 이용한 앙상블 기법입니다. 순차적으로 약한 모델을 향상시켜나갑니다.
부스팅은 아래와 같이 작동합니다 :

모델은 처음 전체 데이터셋에 대해 학습합니다. 이 때 모델은 일부 객체는 올바르게, 일부 객체는 틀리게 예측할 것입니다.
그 다음 시행에서, 틀리게 예측한 객체에 더욱 가중치를 두어 학습합니다. 결과적으로 틀리게 예측한 객체를 올바르게 예측하려고 노력합니다.
이런 과정이 반복되면서, 정확도가 한계에 도달할 때까지 새 분류기가 모델에 추가됩니다.

AdaBoost(Adaptive Boosting)

이번 케이스에서 약한 학습기는 Decision Tree입니다. 하지만 우리는 기본 base_estimator를 우리의 선택에 따라 다른 알고리즘으로 바꿀수 있습니다.

In [67]:
from sklearn.ensemble import AdaBoostClassifier
ada = AdaBoostClassifier(n_estimators=200, random_state = 0, learning_rate = 0.1)
result = cross_val_score(ada, X, Y, cv=10, scoring = 'accuracy')
print('The cross validated score for AdaBoost is: ', result.mean())
The cross validated score for AdaBoost is:  0.8249526160481218

Stochastic Gradient Boosting

이번에도 약한 학습기는 Decision Tree 입니다.

In [68]:
from sklearn.ensemble import GradientBoostingClassifier
grad = GradientBoostingClassifier(n_estimators=500, random_state=0, learning_rate = 0.1)
result = cross_val_score(grad, X, Y, cv=10, scoring = 'accuracy')
print('The cross validated score for Gradient Boosting is: ', result.mean())
The cross validated score for Gradient Boosting is:  0.8182862331176939

XGBoost

In [69]:
import xgboost as xg
xgboost = xg.XGBClassifier(n_estimators=900, learning_rate = 0.1)
result = cross_val_score(xgboost, X, Y, cv=10, scoring='accuracy')
print('The cross validated score for XGBoost is: ', result.mean())
The cross validated score for XGBoost is:  0.8104710021563954

AdaBoost가 가장 높은 정확도를 기록했습니다. 이 정확도를 하이퍼파라미터 튜닝을 통해 더 높여보겠습니다.

AdaBoost의 하이퍼 파라미터 튜닝

In [70]:
n_estimators = list(range(100, 1100, 100))
learning_rate = [0.05, 0.1, 0.2, 0.25, 0.3, 0.4, 0.5, 0.6, 0.7, 0.8, 0.9, 1]
hyper = {'n_estimators' : n_estimators, 'learning_rate' : learning_rate}
gd = GridSearchCV(estimator=AdaBoostClassifier(), param_grid=hyper, verbose=True)
gd.fit(X,Y)
print(gd.best_score_)
print(gd.best_estimator_)
Fitting 3 folds for each of 120 candidates, totalling 360 fits
[Parallel(n_jobs=1)]: Using backend SequentialBackend with 1 concurrent workers.
0.8316498316498316
AdaBoostClassifier(algorithm='SAMME.R', base_estimator=None,
          learning_rate=0.05, n_estimators=200, random_state=None)
[Parallel(n_jobs=1)]: Done 360 out of 360 | elapsed:  3.0min finished

AdaBoost의 정확도는 n_estimator가 200, learning_rate = 0.05일 때 83.16%로 가장 높았습니다.

베스트 모델에 대한 혼동행렬

In [71]:
ada = AdaBoostClassifier(n_estimators=200, random_state=0,learning_rate = 0.05)
result = cross_val_predict(ada, X, Y, cv=10)
sns.heatmap(confusion_matrix(Y, result), cmap='winter', annot=True, fmt = '2.0f')
plt.show()

Feature Importance

In [72]:
f,ax=plt.subplots(2,2,figsize=(15,12))

model=RandomForestClassifier(n_estimators=500,random_state=0)
model.fit(X,Y)
pd.Series(model.feature_importances_,X.columns).sort_values(ascending=True).plot.barh(width=0.8,ax=ax[0,0])
ax[0,0].set_title('Feature Importance in Random Forests')

model=AdaBoostClassifier(n_estimators=200,learning_rate=0.05,random_state=0)
model.fit(X,Y)
pd.Series(model.feature_importances_,X.columns).sort_values(ascending=True).plot.barh(width=0.8,ax=ax[0,1],color='#ddff11')
ax[0,1].set_title('Feature Importance in AdaBoost')

model=GradientBoostingClassifier(n_estimators=500,learning_rate=0.1,random_state=0)
model.fit(X,Y)
pd.Series(model.feature_importances_,X.columns).sort_values(ascending=True).plot.barh(width=0.8,ax=ax[1,0],cmap='RdYlGn_r')
ax[1,0].set_title('Feature Importance in Gradient Boosting')

model=xg.XGBClassifier(n_estimators=900, learning_rate=0.1)
model.fit(X,Y)
pd.Series(model.feature_importances_,X.columns).sort_values(ascending=True).plot.barh(width=0.8,ax=ax[1,1],color='#FD0F00')
ax[1,1].set_title('Feature Importance in XgBoost')

plt.show()

Random Forest, AdaBoost 등 여러 모델들에 대한 feature importance를 볼 수 있습니다.

1) 공통적으로 중요한 feature는 Initial ,Fare_cat, Pclass, Family_Size 입니다.

2) Sex 는 그렇게 중요도가 높지 않았는데, 앞선 분석에서 Pclass와 함께 보았을 때 성별이 중요한 요소였던 것을 생각하면 놀라운 결과입니다.
성별은 Random Forest 모델에서만 중요해보입니다.

하지만 많은 분류기의 최상단에 있는 Initial은 Sex과 양의 상관관계에 있습니다. 결국, 두 정보 모두 성별에 대한 정보를 담고 있습니다.

3) 이와 비슷하게 Pclass와 Fare_cat 모두 탑승객의 지위와 Family_Size, Alone, Parch, SibSp의 정보를 담고 있습니다.

3. Subset Observations(Columns) (열 데이터 다루기)
In [1]:
from IPython.core.display import display, HTML
display(HTML("<style> .container{width:90% !important;}</style>"))
In [2]:
import pandas as pd
import seaborn as sns
In [3]:
# 예시 데이터 불러오기
df = sns.load_dataset('iris')
print(df.shape)
df.head()
(150, 5)
Out[3]:
sepal_length sepal_width petal_length petal_width species
0 5.1 3.5 1.4 0.2 setosa
1 4.9 3.0 1.4 0.2 setosa
2 4.7 3.2 1.3 0.2 setosa
3 4.6 3.1 1.5 0.2 setosa
4 5.0 3.6 1.4 0.2 setosa

데이터프레임에서 특정 컬럼 정보만 불러오기

In [4]:
columns = ['sepal_length', 'sepal_width', 'species']
df[columns].head()
Out[4]:
sepal_length sepal_width species
0 5.1 3.5 setosa
1 4.9 3.0 setosa
2 4.7 3.2 setosa
3 4.6 3.1 setosa
4 5.0 3.6 setosa
In [5]:
# 이 방식에서는 한글이나 특수문자가 들어간 컬럼명을 쓸 수 없음
df.sepal_width.head() 
Out[5]:
0    3.5
1    3.0
2    3.2
3    3.1
4    3.6
Name: sepal_width, dtype: float64
In [6]:
df['sepal_width'].head()
Out[6]:
0    3.5
1    3.0
2    3.2
3    3.1
4    3.6
Name: sepal_width, dtype: float64

정규 표현식으로 특정컬럼 불러오기

df.filter( regex = 'regex' )

  • '\.' : 점( . )을 포함하고 있는 문자열
In [7]:
df.filter(regex='\,').head(3)
Out[7]:
0
1
2
  • 'length$' : 특정문자열(length)로 끝나는 문자열
In [8]:
df.filter(regex='length$').head(3)
Out[8]:
sepal_length petal_length
0 5.1 1.4
1 4.9 1.4
2 4.7 1.3
  • '_' : _ 를 포함하고 있는 문자열
In [9]:
df.filter(regex='_').head(3)
Out[9]:
sepal_length sepal_width petal_length petal_width
0 5.1 3.5 1.4 0.2
1 4.9 3.0 1.4 0.2
2 4.7 3.2 1.3 0.2
  • '^sepal' : 특정문자열(Sepal)로 시작하는 문자열
In [10]:
df.filter(regex='^sepal').head(3)
Out[10]:
sepal_length sepal_width
0 5.1 3.5
1 4.9 3.0
2 4.7 3.2
  • *'^(?!species$).' : 특정문자열('species')이 없는 문자열
In [11]:
df.filter(regex='^(?!species).*').head(3)
Out[11]:
sepal_length sepal_width petal_length petal_width
0 5.1 3.5 1.4 0.2
1 4.9 3.0 1.4 0.2
2 4.7 3.2 1.3 0.2
  • '^x[1-5]$' : 특정문자(x)로 시작하고 특정문자(1, 2, 3, 4, 5)로 끝나는 문자열
In [12]:
df.filter(regex='^x[1-5]$').head(3)
Out[12]:
0
1
2

df.loc[ ]와 df.iloc[ ] 비교

In [13]:
df.loc[2:5, 'sepal_width':'petal_width']
Out[13]:
sepal_width petal_length petal_width
2 3.2 1.3 0.2
3 3.1 1.5 0.2
4 3.6 1.4 0.2
5 3.9 1.7 0.4

loc와는 다르게 iloc로 검색을 했을 때 a:b 면 b-1행까지 검색을 함
iloc는 인덱스번호만 입력이 가능함

In [14]:
df.iloc[2:5:,  1:3]
Out[14]:
sepal_width petal_length
2 3.2 1.3
3 3.1 1.5
4 3.6 1.4

loc 를 통해 logic 조건으로 행을 지정하고, 컬럼명을 선택할 수 있음

In [15]:
df.loc[df['sepal_length']>3 , ['sepal_length','sepal_width']].head()
Out[15]:
sepal_length sepal_width
0 5.1 3.5
1 4.9 3.0
2 4.7 3.2
3 4.6 3.1
4 5.0 3.6
2. Subset Observations(Rows) (행 데이터 다루기)
In [1]:
from IPython.core.display import display, HTML
display(HTML("<style> .container{width:90% !important;}</style>"))
In [2]:
import pandas as pd
import numpy as np
In [3]:
# 데이터프레임 생성
df = pd.DataFrame(
                            {'a' : [4, 5, 6], 
                             'b' : [7, 8, 9],
                             'c' : [6, 9, 12]},
                            index = pd.MultiIndex.from_tuples( [('d', 1), ('d', 2), ('e', 2)] ,
                                                                                     names = ['n', 'v'] )
                                )

df
Out[3]:
a b c
n v
d 1 4 7 6
2 5 8 9
e 2 6 9 12

True/False (불린인덱싱)을 이용한 행 데이터 조회

In [4]:
# 기본적으로  <, >, = 와 같은 연산자를 이용하면 아래와 같이 불린 값이 반환된다.
df['a'] < 6
Out[4]:
n  v
d  1     True
   2     True
e  2    False
Name: a, dtype: bool
In [5]:
# True로 값을 반환한 행에 대해서만 데이터를 불러온다.
df[df['a'] < 6]
Out[5]:
a b c
n v
d 1 4 7 6
2 5 8 9

중복데이터 제거 : df.drop_duplicates( )

In [6]:
# 중복된 행을 가지는 임의의 데이터프레임 생성
df = pd.DataFrame(
                {'a' : [4, 5, 6, 6 ],
                 'b' : [7, 8, 9, 9],
                 'c' : [6, 9, 12, 12]},
                index = pd.MultiIndex.from_tuples(
                                    [('d', 1), ('d',2), ('e', 2), ('e', 3)],
                                    names = ['n', 'v']    )
                                )
df
Out[6]:
a b c
n v
d 1 4 7 6
2 5 8 9
e 2 6 9 12
3 6 9 12
In [7]:
# drop_duplicates을 수행하면 중복된 행을 제거해준다
df.drop_duplicates()
Out[7]:
a b c
n v
d 1 4 7 6
2 5 8 9
e 2 6 9 12
In [8]:
# 하지만 위의 코드를 실행 후 다시 데이터프레임을 불러오면 중복된 값이 그대로 살아있다.
df
Out[8]:
a b c
n v
d 1 4 7 6
2 5 8 9
e 2 6 9 12
3 6 9 12
In [9]:
# 결과를 데이터프레임에 적용하려면 아래와 같이 괄호 안에 inplace = True 추가하면 된다.
# df.drop_duplicates(inplace=True)

# 하지만 권장되는 방법은 아니며 주로 아래와 같이 기존 데이터 프레임에 덧씌우는 방식을 사용
df = df.drop_duplicates()
In [10]:
# 중복데이터가 제거된체 데이터프레임이 저장되었음을 확인할 수 있다.
df
Out[10]:
a b c
n v
d 1 4 7 6
2 5 8 9
e 2 6 9 12

Logic in 파이썬(판다스)

연산자 의미 연산자 의미
< Less than != Not equal to
> Greater than df['column명'].isin(values) value값을 포함하는지의 여부
== equal pd.isnull(obj) Null값 여부
<= Less than or equals pd.notnull(obj) Not Null 여부
>= Greater than or equals &, I , ~, ^, any( ) , df.all( ) and, or, not, xor, any, all
In [11]:
# 예시데이터 불러오기
import numpy as np

df = pd.DataFrame(
                {'a' : [4, 5, 6, 6, np.nan ],
                 'b' : [7, 8, 9, 9, np.nan],
                 'c' : [6, 9, 12, np.nan, 12]},
                index = pd.MultiIndex.from_tuples(
                                    [('d', 1), ('d',2), ('e', 2), ('e', 3), ('e', 4)],
                                    names = ['n', 'v']    )
                                )
df
Out[11]:
a b c
n v
d 1 4.0 7.0 6.0
2 5.0 8.0 9.0
e 2 6.0 9.0 12.0
3 6.0 9.0 NaN
4 NaN NaN 12.0

예시를 이용해서 로직 하나씩 실행해보기

In [12]:
df['a'] < 5
Out[12]:
n  v
d  1     True
   2    False
e  2    False
   3    False
   4    False
Name: a, dtype: bool
In [13]:
df['b'] != 7
Out[13]:
n  v
d  1    False
   2     True
e  2     True
   3     True
   4     True
Name: b, dtype: bool
In [14]:
df['a'] == 5
Out[14]:
n  v
d  1    False
   2     True
e  2    False
   3    False
   4    False
Name: a, dtype: bool
In [15]:
df['a'].isin([5])
Out[15]:
n  v
d  1    False
   2     True
e  2    False
   3    False
   4    False
Name: a, dtype: bool
In [16]:
pd.isnull(df)
Out[16]:
a b c
n v
d 1 False False False
2 False False False
e 2 False False False
3 False False True
4 True True False
In [17]:
# isnull() 과 sum() 을 같이 활용해서 null 값의 수를 셀 수 있다.
df['a'].isnull().sum()
Out[17]:
1
In [18]:
pd.notnull(df)
Out[18]:
a b c
n v
d 1 True True True
2 True True True
e 2 True True True
3 True True False
4 False False True
In [19]:
# isnull() 과 any()를 동시에 사용해서 null 값이 하나라도 있으면 True를 반환
df.isnull().any()
Out[19]:
a    True
b    True
c    True
dtype: bool
In [20]:
# isnull() 과 all()를 동시에 사용해서 모두 null 값이면 True를 반환
df.isnull().all()
Out[20]:
a    False
b    False
c    False
dtype: bool
In [21]:
# ~ 는 not 의 의미로 아래에서는 결국 Null이면 True를 반환
~df['a'].notnull()
Out[21]:
n  v
d  1    False
   2    False
e  2    False
   3    False
   4     True
Name: a, dtype: bool
In [22]:
# 데이터프레임에서는 and를 쓸 수 없고 & 를 사용해야함
df[(df['b']==7) and (df['a'] ==4) ]
---------------------------------------------------------------------------
ValueError                                Traceback (most recent call last)
<ipython-input-22-6decfb4c32c4> in <module>
      1 # 데이터프레임에서는 and를 쓸 수 없고 & 를 사용해야함
----> 2 df[(df['b']==7) and (df['a'] ==4) ]

/anaconda3/lib/python3.7/site-packages/pandas/core/generic.py in __nonzero__(self)
   1476         raise ValueError("The truth value of a {0} is ambiguous. "
   1477                          "Use a.empty, a.bool(), a.item(), a.any() or a.all()."
-> 1478                          .format(self.__class__.__name__))
   1479 
   1480     __bool__ = __nonzero__

ValueError: The truth value of a Series is ambiguous. Use a.empty, a.bool(), a.item(), a.any() or a.all().
In [23]:
df[ (df['b']==7) & (df['a'] ==4) ]
Out[23]:
a b c
n v
d 1 4.0 7.0 6.0

데이터프레임의 일부샘플 조회하기

df.head( ) 와 df.tail( ) 을 이용한 조회

In [24]:
# 최초 n행 조회하기 (default는 5행)
df.head(2)
Out[24]:
a b c
n v
d 1 4.0 7.0 6.0
2 5.0 8.0 9.0
In [25]:
# 마지막 n행 조회하기 (default는 5행)
df.tail(2)
Out[25]:
a b c
n v
e 3 6.0 9.0 NaN
4 NaN NaN 12.0

df.sample( ) 을 이용한 샘플 추출

In [26]:
# 전체 데이터프레임에서 특정 비율만큼 샘플링하는 것
df.sample(frac=0.5) 
Out[26]:
a b c
n v
e 2 6.0 9.0 12.0
d 1 4.0 7.0 6.0
In [27]:
# 하지만 코드를 실행할 때마다 다른 샘플이 나옴
df.sample(frac=0.5) 
Out[27]:
a b c
n v
e 3 6.0 9.0 NaN
d 1 4.0 7.0 6.0
In [28]:
# 아래와 같이 난수값을 설정함으로써 일관된 샘플을 할 수 있다.
df.sample(frac=0.5, random_state=5) 
Out[28]:
a b c
n v
e 4 NaN NaN 12.0
d 1 4.0 7.0 6.0
In [29]:
# 샘플 갯수 설정
df.sample(n=3)
Out[29]:
a b c
n v
e 2 6.0 9.0 12.0
3 6.0 9.0 NaN
d 1 4.0 7.0 6.0

df.iloc[ ]와 콜론(:)을 이용한 데이터프레임 조회

In [30]:
# df.iloc[인덱스 시작: 인덱스 끝]
# iloc로 조회를 할 떄 인덱스 끝의 바로 앞 데이터까지만 조회가 된다.
df.iloc[2:4]  
Out[30]:
a b c
n v
e 2 6.0 9.0 12.0
3 6.0 9.0 NaN
In [31]:
# 콜론 앞에 아무것도 입력하지 않으면 첫 데이터부터 조회
df.iloc[:4]
Out[31]:
a b c
n v
d 1 4.0 7.0 6.0
2 5.0 8.0 9.0
e 2 6.0 9.0 12.0
3 6.0 9.0 NaN
In [32]:
# 음수값을 입력하면 뒤에서 몇번째인지를 나타냄
# 아래 코드는 뒤에서 두번째 행부터 끝까지 조회
df.iloc[-2:]
Out[32]:
a b c
n v
e 3 6.0 9.0 NaN
4 NaN NaN 12.0
In [33]:
# df.iloc 
df.iloc[2:4, 1:]
Out[33]:
b c
n v
e 2 9.0 12.0
3 9.0 NaN

df.nlargest( ) 과 df.nsmallest( )

In [34]:
# 샘플 데이터프레임 생성
df = pd.DataFrame(  { 'a' : [1, 10, 8, 11, -1],
                             'b' : list('abcde'),
                             'c' : [1.0, 2.0, np.nan, 3.0, 4.0]}  )
df
Out[34]:
a b c
0 1 a 1.0
1 10 b 2.0
2 8 c NaN
3 11 d 3.0
4 -1 e 4.0
In [35]:
# 가장 큰  a 값을 가진 행 조회
df.nlargest(1, 'a')
Out[35]:
a b c
3 11 d 3.0
In [36]:
#  a 값이 큰 순서대로 상위 3개 행 조회
df.nlargest(3, 'a')
Out[36]:
a b c
3 11 d 3.0
1 10 b 2.0
2 8 c NaN
In [37]:
# 문자열에는 사용할 수 없음
df.nlargest(2, 'b')
---------------------------------------------------------------------------
TypeError                                 Traceback (most recent call last)
<ipython-input-37-b38daf335006> in <module>
      1 # 문자열에는 사용할 수 없음
----> 2 df.nlargest(2, 'b')

/anaconda3/lib/python3.7/site-packages/pandas/core/frame.py in nlargest(self, n, columns, keep)
   4909                                        n=n,
   4910                                        keep=keep,
-> 4911                                        columns=columns).nlargest()
   4912 
   4913     def nsmallest(self, n, columns, keep='first'):

/anaconda3/lib/python3.7/site-packages/pandas/core/algorithms.py in nlargest(self)
   1056 
   1057     def nlargest(self):
-> 1058         return self.compute('nlargest')
   1059 
   1060     def nsmallest(self):

/anaconda3/lib/python3.7/site-packages/pandas/core/algorithms.py in compute(self, method)
   1172                     "Column {column!r} has dtype {dtype}, cannot use method "
   1173                     "{method!r} with this dtype"
-> 1174                 ).format(column=column, dtype=dtype, method=method))
   1175 
   1176         def get_indexer(current_indexer, other_indexer):

TypeError: Column 'b' has dtype object, cannot use method 'nlargest' with this dtype
In [38]:
#  a 값이 작은 순서대로 상위 3개 행 조회
df.nsmallest(3, 'a')
Out[38]:
a b c
4 -1 e 4.0
0 1 a 1.0
2 8 c NaN
1. Creating DataFrames (데이터 프레임 만들기)
In [1]:
from IPython.core.display import display, HTML
display(HTML("<style> .container{width:90% !important;}</style>"))

딕셔너리를 사용하여 DataFrame 생성하기

In [2]:
import pandas as pd
In [3]:
# 인덱스 옵션을 넣지 않으면 행 인덱스가 0부터 생성
df = pd.DataFrame(
                {'a' : [4, 5, 6],
                 'b' : [7, 8, 9],
                 'c' : [10, 11, 12]},
                )

df
Out[3]:
a b c
0 4 7 10
1 5 8 11
2 6 9 12
In [4]:
# 인덱스 값을 입력해서 내가 원하는 임의의 인덱스 값을 설정할 수 있다.
df = pd.DataFrame(
                {'a' : [4, 5, 6],
                 'b' : [7, 8, 9],
                 'c' : [10, 11, 12]},
                 index = [1, 2, 3]
                )

df
Out[4]:
a b c
1 4 7 10
2 5 8 11
3 6 9 12

데이터 프레임에서 특정 데이터 불러오기

In [5]:
# 하나의 컬럼만 불러오기
df['a']
Out[5]:
1    4
2    5
3    6
Name: a, dtype: int64
In [6]:
# 두 개 이상의 컬럼을 불러올 때는 대괄호 안에 리스트 형식으로 불러온다.
df[ ['a','b'] ]
Out[6]:
a b
1 4 7
2 5 8
3 6 9
In [7]:
# 행(혹은 인덱스) 기준으로 데이터를 불러올 때는 df.loc[인덱스] 를 사용
df.loc[2]
Out[7]:
a     5
b     8
c    11
Name: 2, dtype: int64
In [8]:
# df.loc[인덱스, 컬럼명] 을 사용해서 특정 행, 열의 데이터를 불러올 수 있다
df.loc[2, 'a']
Out[8]:
5
In [9]:
# 이 때 복수의 행과 열을 조회할 때는 행과 열을 각각 리스트 형식으로 적어주면 된다
df.loc[[1, 2], ['a', 'b']]
Out[9]:
a b
1 4 7
2 5 8

리스트를 사용해서 컬럼명 만들기

In [10]:
# 리스트를 사용하여 데이터프레임을 만들 때, 컬럼명 옵션을 입력하지 않으면
# 0부터 순서대로 컬럼명이 만들어진다
df = pd.DataFrame(
                [ [4, 5, 6],
                  [7, 8, 9],
                  [10, 11, 12]],
                index = [1, 2, 3]
                )

df
Out[10]:
0 1 2
1 4 5 6
2 7 8 9
3 10 11 12
In [11]:
# 때문에 리스트로 데이터 프레임을 만들 때 아래 처럼 컬럼명을 설정해주는 것이 보통
df = pd.DataFrame(
                [ [4, 5, 6],
                  [7, 8, 9],
                  [10, 11, 12]],
                 index = [1, 2, 3],
                columns = ['a', 'b', 'c']
                )

df
Out[11]:
a b c
1 4 5 6
2 7 8 9
3 10 11 12

데이터프레임 만들기 : Multi Index

In [12]:
# 복수의 인덱스를 만들어 줄 수도 있음 (pd.Multiindex 사용)
df = pd.DataFrame(
                            {'a' : [4, 5, 6], 
                             'b' : [7, 8, 9],
                             'c' : [6, 9, 12]},
                            index = pd.MultiIndex.from_tuples( [('d', 1), ('d', 2), ('e', 2)] ,
                                                                                     names = ['n', 'v'] )
                                )

df
Out[12]:
a b c
n v
d 1 4 7 6
2 5 8 9
e 2 6 9 12
4-1. Decision Tree
In [1]:
from IPython.core.display import display, HTML
display(HTML("<style> .container{width:90% !important;}</style>"))

1. Intro

Decision Tree(결정트리) :

데이터에 있는 규칙을 학습을 통해 자동으로 찾아내 트리 기반의 분류 규칙을 만드는 알고리즘입니다.
(조금 더 쉽게 하자면 if else를 자동으로 찾아내 예측을 위한 규칙을 만드는 알고리즘입니다.)

Decision Tree의 구조

  • 루트노드(Root Node) : 시작점
  • 리프노드(Leaf Node) : 결정된 클래스 값
  • 규칙노드/내부노드(Decision Node / Internal Node) : 데이터세트의 피처가 결합해 만들어진 분류를 위한 규칙조건

타이타닉 예제에서의 Decision Tree 예시

위의 그림은 타이타닉 예제를 통해 Decision Tree의 구조를 간략히 나타낸 것으로 아래와 같이 노드를 분류할 수 있습니다.

  • Is Passenger Male? : 루트노드
  • Age < 18? , 3rd Class?, Embarked from Southhampton? : 규칙노드
  • Died, Survived : 리프노드

하지만 Decision Tree에서 많은 규칙이 있다는 것은 분류 방식이 복잡해진다는 것이고
이는 과적합(Overfitting)으로 이어지기 쉽습니다.
(트리의 깊이(depth)가 깊어질수록 결정트리는 과적합되기 쉬워 예측 성능이 저하될 수 있습니다.)


가능한 적은 규칙노드로 높은 성능을 가지려면 데이터 분류를 할 때
최대한 많은 데이터 세트가 해당 분류에 속할 수 있도록 규칙 노드의 규칙이 정해져야 합니다.
이를 위해 최대한 균일한 데이터 세트가 구성되도록 분할(Split)하는 것이 필요합니다.
(분할된 데이터가 특정 속성을 잘 나타내야 한다는 것입니다.)

규칙 노드는 정보균일도가 높은 데이터 세트로 쪼개지도록 조건을 찾아 서브 데이터 세트를 만들고,
이 서브 데이터에서 이런 작업을 반복하며 최종 클래스를 예측하게 됩니다.

사이킷런에서는 기본적으로 지니계수를 이용하여 데이터를 분할합니다.

지니계수 : 경제학에서 불평등지수를 나타낼 때 사용하는 것으로 0일 때 완전 평등, 1일 때 완전 불평등을 의미합니다.

머신러닝에서는 데이터가 다양한 값을 가질수록 평등하며 특정 값으로 쏠릴 때 불평등한 값이 됩니다.
즉, 다양성이 낮을수록 균일도가 높다는 의미로 1로 갈수록 균일도가 높아 지니계수가 높은 속성을 기준으로 분할

2. Decision Tree의 장단점

장점

  • 쉽고 직관적입니다.
  • 각 피처의 스케일링과 정규화 같은 전처리 작업의 영향도가 크지 않습니다.

단점

  • 규칙을 추가하며 서브트리를 만들어 나갈수록 모델이 복잡해지고, 과적합에 빠지기 쉽습니다.
    → 트리의 크기를 사전에 제한하는 튜닝이 필요합니다.

3. Decision Tree Classifier의 파라미터

파라미터 명 설명
min_samples_split - 노드를 분할하기 위한 최소한의 샘플 데이터수 → 과적합을 제어하는데 사용
- Default = 2 → 작게 설정할 수록 분할 노드가 많아져 과적합 가능성 증가
min_samples_leaf - 리프노드가 되기 위해 필요한 최소한의 샘플 데이터수
- min_samples_split과 함께 과적합 제어 용도
- 불균형 데이터의 경우 특정 클래스의 데이터가 극도로 작을 수 있으므로 작게 설정 필요
max_features - 최적의 분할을 위해 고려할 최대 feature 개수
- Default = None → 데이터 세트의 모든 피처를 사용
- int형으로 지정 →피처 갯수 / float형으로 지정 →비중
- sqrt 또는 auto : 전체 피처 중 √(피처개수) 만큼 선정
- log : 전체 피처 중 log2(전체 피처 개수) 만큼 선정
max_depth - 트리의 최대 깊이
- default = None
→ 완벽하게 클래스 값이 결정될 때 까지 분할
또는 데이터 개수가 min_samples_split보다 작아질 때까지 분할
- 깊이가 깊어지면 과적합될 수 있으므로 적절히 제어 필요
max_leaf_nodes 리프노드의 최대 개수

4. Decision Tree모델의 시각화

사이킷런의 붓꽃 데이터 세트를 이용한 DecisionTree 시각화

In [2]:
from sklearn.tree import DecisionTreeClassifier
from sklearn.datasets import load_iris
from sklearn.model_selection import train_test_split
import warnings
warnings.filterwarnings('ignore')

# DecicionTreeClassifier 생성
dt_clf = DecisionTreeClassifier(random_state=156)

# 붓꽃 데이터를 로딩하고, 학습과 테스트 데이터 세트로 분리
iris_data = load_iris()
X_train, X_test, y_train, y_test = train_test_split(iris_data.data, iris_data.target, test_size=0.2, random_state=11)

# DecisionTreeClassifier 학습
dt_clf.fit(X_train, y_train)
Out[2]:
DecisionTreeClassifier(class_weight=None, criterion='gini', max_depth=None,
            max_features=None, max_leaf_nodes=None,
            min_impurity_decrease=0.0, min_impurity_split=None,
            min_samples_leaf=1, min_samples_split=2,
            min_weight_fraction_leaf=0.0, presort=False, random_state=156,
            splitter='best')
In [3]:
from sklearn.tree import export_graphviz

# export_graphviz( )의 호출 결과로 out_file로 지정된 tree.dot 파일을 생성함
export_graphviz(dt_clf, out_file="tree.dot", class_names = iris_data.target_names, 
                           feature_names = iris_data.feature_names, impurity=True, filled=True)
In [4]:
print('===============max_depth의 제약이 없는 경우의 Decision Tree 시각화==================')
import graphviz
# 위에서 생성된 tree.dot 파일을 Graphiviz 가 읽어서 시각화
with open("tree.dot") as f:
    dot_graph = f.read()
graphviz.Source(dot_graph)
===============max_depth의 제약이 없는 경우의 Decision Tree 시각화==================
Out[4]:
Tree 0 petal length (cm) <= 2.45 gini = 0.667 samples = 120 value = [41, 40, 39] class = setosa 1 gini = 0.0 samples = 41 value = [41, 0, 0] class = setosa 0->1 True 2 petal width (cm) <= 1.55 gini = 0.5 samples = 79 value = [0, 40, 39] class = versicolor 0->2 False 3 petal length (cm) <= 5.25 gini = 0.051 samples = 38 value = [0, 37, 1] class = versicolor 2->3 6 petal width (cm) <= 1.75 gini = 0.136 samples = 41 value = [0, 3, 38] class = virginica 2->6 4 gini = 0.0 samples = 37 value = [0, 37, 0] class = versicolor 3->4 5 gini = 0.0 samples = 1 value = [0, 0, 1] class = virginica 3->5 7 sepal length (cm) <= 5.45 gini = 0.5 samples = 4 value = [0, 2, 2] class = versicolor 6->7 12 petal length (cm) <= 4.85 gini = 0.053 samples = 37 value = [0, 1, 36] class = virginica 6->12 8 gini = 0.0 samples = 1 value = [0, 0, 1] class = virginica 7->8 9 petal length (cm) <= 5.45 gini = 0.444 samples = 3 value = [0, 2, 1] class = versicolor 7->9 10 gini = 0.0 samples = 2 value = [0, 2, 0] class = versicolor 9->10 11 gini = 0.0 samples = 1 value = [0, 0, 1] class = virginica 9->11 13 sepal length (cm) <= 5.95 gini = 0.444 samples = 3 value = [0, 1, 2] class = virginica 12->13 16 gini = 0.0 samples = 34 value = [0, 0, 34] class = virginica 12->16 14 gini = 0.0 samples = 1 value = [0, 1, 0] class = versicolor 13->14 15 gini = 0.0 samples = 2 value = [0, 0, 2] class = virginica 13->15
  • petal length(cm) <= 2.45 와 같이 조건이 있는 것은 자식 노드를 만들기 위한 규칙 조건으로 이런 것이 없는 것은 리프노드입니다.
  • gini는 다음의 value = [ ] 로 주어진 데이터 분포에서의 지니계수
  • samples : 현 규칙에 해당하는 데이터 건수
  • value = [ ] 클래스 값 기반의 데이터 건수 ( 이번 예제의 경우 0: Setosa, 1 : Veericolor, 2: Virginia 를 나타냄 )
In [5]:
# DecicionTreeClassifier 생성 (max_depth = 3 으로 제한)
dt_clf = DecisionTreeClassifier(max_depth=3 ,random_state=156)
dt_clf.fit(X_train, y_train)

# export_graphviz( )의 호출 결과로 out_file로 지정된 tree.dot 파일을 생성함
export_graphviz(dt_clf, out_file="tree.dot", class_names = iris_data.target_names, 
                           feature_names = iris_data.feature_names, impurity=True, filled=True)

print('===============max_depth=3인 경우의 Decision Tree 시각화==================')
import graphviz
# 위에서 생성된 tree.dot 파일을 Graphiviz 가 읽어서 시각화
with open("tree.dot") as f:
    dot_graph = f.read()
graphviz.Source(dot_graph)
===============max_depth=3인 경우의 Decision Tree 시각화==================
Out[5]:
Tree 0 petal length (cm) <= 2.45 gini = 0.667 samples = 120 value = [41, 40, 39] class = setosa 1 gini = 0.0 samples = 41 value = [41, 0, 0] class = setosa 0->1 True 2 petal width (cm) <= 1.55 gini = 0.5 samples = 79 value = [0, 40, 39] class = versicolor 0->2 False 3 petal length (cm) <= 5.25 gini = 0.051 samples = 38 value = [0, 37, 1] class = versicolor 2->3 6 petal width (cm) <= 1.75 gini = 0.136 samples = 41 value = [0, 3, 38] class = virginica 2->6 4 gini = 0.0 samples = 37 value = [0, 37, 0] class = versicolor 3->4 5 gini = 0.0 samples = 1 value = [0, 0, 1] class = virginica 3->5 7 gini = 0.5 samples = 4 value = [0, 2, 2] class = versicolor 6->7 8 gini = 0.053 samples = 37 value = [0, 1, 36] class = virginica 6->8

max_depth를 3으로 제한한 결과 처음보다 간결한 형태의 트리가 만들어졌습니다.

In [6]:
# DecicionTreeClassifier 생성 (min_samples_split=4로 상향)
dt_clf = DecisionTreeClassifier(min_samples_split=4 ,random_state=156)
dt_clf.fit(X_train, y_train)

# export_graphviz( )의 호출 결과로 out_file로 지정된 tree.dot 파일을 생성함
export_graphviz(dt_clf, out_file="tree.dot", class_names = iris_data.target_names, 
                           feature_names = iris_data.feature_names, impurity=True, filled=True)

print('===============min_samples_split=4인 경우의 Decision Tree 시각화==================')
import graphviz
# 위에서 생성된 tree.dot 파일을 Graphiviz 가 읽어서 시각화
with open("tree.dot") as f:
    dot_graph = f.read()
graphviz.Source(dot_graph)
===============min_samples_split=4인 경우의 Decision Tree 시각화==================
Out[6]:
Tree 0 petal length (cm) <= 2.45 gini = 0.667 samples = 120 value = [41, 40, 39] class = setosa 1 gini = 0.0 samples = 41 value = [41, 0, 0] class = setosa 0->1 True 2 petal width (cm) <= 1.55 gini = 0.5 samples = 79 value = [0, 40, 39] class = versicolor 0->2 False 3 petal length (cm) <= 5.25 gini = 0.051 samples = 38 value = [0, 37, 1] class = versicolor 2->3 6 petal width (cm) <= 1.75 gini = 0.136 samples = 41 value = [0, 3, 38] class = virginica 2->6 4 gini = 0.0 samples = 37 value = [0, 37, 0] class = versicolor 3->4 5 gini = 0.0 samples = 1 value = [0, 0, 1] class = virginica 3->5 7 sepal length (cm) <= 5.45 gini = 0.5 samples = 4 value = [0, 2, 2] class = versicolor 6->7 10 petal length (cm) <= 4.85 gini = 0.053 samples = 37 value = [0, 1, 36] class = virginica 6->10 8 gini = 0.0 samples = 1 value = [0, 0, 1] class = virginica 7->8 9 gini = 0.444 samples = 3 value = [0, 2, 1] class = versicolor 7->9 11 gini = 0.444 samples = 3 value = [0, 1, 2] class = virginica 10->11 12 gini = 0.0 samples = 34 value = [0, 0, 34] class = virginica 10->12

sample = 3 인 경우 샘플 내 상이한 값이 있어도 처음과 달리 더 이상 분할하지 않게 되어 트리의 깊이가 줄어들었습니다.

In [7]:
# DecicionTreeClassifier 생성 (min_samples_leaf=4로 상향)
dt_clf = DecisionTreeClassifier(min_samples_leaf=4 ,random_state=156)
dt_clf.fit(X_train, y_train)

# export_graphviz( )의 호출 결과로 out_file로 지정된 tree.dot 파일을 생성함
export_graphviz(dt_clf, out_file="tree.dot", class_names = iris_data.target_names, 
                           feature_names = iris_data.feature_names, impurity=True, filled=True)

print('===============min_samples_leaf=4인 경우의 Decision Tree 시각화==================')
import graphviz
# 위에서 생성된 tree.dot 파일을 Graphiviz 가 읽어서 시각화
with open("tree.dot") as f:
    dot_graph = f.read()
graphviz.Source(dot_graph)
===============min_samples_leaf=4인 경우의 Decision Tree 시각화==================
Out[7]:
Tree 0 petal length (cm) <= 2.45 gini = 0.667 samples = 120 value = [41, 40, 39] class = setosa 1 gini = 0.0 samples = 41 value = [41, 0, 0] class = setosa 0->1 True 2 petal width (cm) <= 1.55 gini = 0.5 samples = 79 value = [0, 40, 39] class = versicolor 0->2 False 3 petal length (cm) <= 4.75 gini = 0.051 samples = 38 value = [0, 37, 1] class = versicolor 2->3 6 petal width (cm) <= 1.75 gini = 0.136 samples = 41 value = [0, 3, 38] class = virginica 2->6 4 gini = 0.0 samples = 34 value = [0, 34, 0] class = versicolor 3->4 5 gini = 0.375 samples = 4 value = [0, 3, 1] class = versicolor 3->5 7 gini = 0.5 samples = 4 value = [0, 2, 2] class = versicolor 6->7 8 sepal length (cm) <= 5.95 gini = 0.053 samples = 37 value = [0, 1, 36] class = virginica 6->8 9 gini = 0.375 samples = 4 value = [0, 1, 3] class = virginica 8->9 10 gini = 0.0 samples = 33 value = [0, 0, 33] class = virginica 8->10

자식이 없는 리프노드는 클래스 결정 값이 되는데 min_samples_leaf 는 리프노드가 될 수 있는 샘플 데이터의 최소 갯수를 지정합니다.

위와 비교해보면 기존에 샘플갯수가 3이하이던 리프노드들이 샘플갯수가 4가 되도로 변경되었음을 볼 수 있습니다.
결과적으로 처음보다 트리가 간결해졌습니다.

Feature Importance 시각화

학습을 통해 규칙을 정하는 데 있어 피처의 중요도를 DecisionTreeClassifier 객체의 featureimportances 속성으로 확인할 수 있습니다.
→기본적으로 ndarray형태로 값을 반환하며 피처 순서대로 값이 할당

In [8]:
import seaborn as sns
import numpy as np
%matplotlib inline

# feature importance 추출
print("Feature Importances:\n{0}\n".format(np.round(dt_clf.feature_importances_, 3)))

# feature 별 feature importance 매핑
for name, value in zip(iris_data.feature_names, dt_clf.feature_importances_):
    print('{0}: {1:.3f}'.format(name, value))
    
# feature importance 시각화
sns.barplot(x=dt_clf.feature_importances_, y=iris_data.feature_names)
Feature Importances:
[0.006 0.    0.546 0.448]

sepal length (cm): 0.006
sepal width (cm): 0.000
petal length (cm): 0.546
petal width (cm): 0.448
Out[8]:
<matplotlib.axes._subplots.AxesSubplot at 0x1a1eaa0c88>

5. Decision Tree의 과적합(Overfitting)

임의의 데이터 세트를 통한 과적합 문제 시각화

In [9]:
from sklearn.datasets import make_classification
import matplotlib.pyplot as plt

plt.title("3 Class values with 2 Features Sample Data Creation")

# 2차원 시각화를 위해 피처는 2개, 클래스는 3가지 유형의 분류 샘플 데이터 생성
X_features, y_labels = make_classification(n_features=2, n_redundant=0, n_informative=2,
                                                                  n_classes=3, n_clusters_per_class=1, random_state=0)

# 그래프 형태로 2개의 피쳐로 2차원 좌표 시각화, 각 클래스 값은 다른 색으로 표시
plt.scatter(X_features[:, 0], X_features[:, 1], marker='o', c=y_labels, s=25, edgecolor = 'k', cmap='rainbow')
Out[9]:
<matplotlib.collections.PathCollection at 0x1a1f91a940>

우선 트리 생성 시 파라미터를 디폴트로 놓고, 데이터가 어떻게 분류되는지 확인

In [10]:
# Classifier의 Decision Boundary를 시각화 하는 함수
def visualize_boundary(model, X, y):
    fig,ax = plt.subplots()
    
    # 학습 데이타 scatter plot으로 나타내기
    ax.scatter(X[:, 0], X[:, 1], c=y, s=25, cmap='rainbow', edgecolor='k',
               clim=(y.min(), y.max()), zorder=3)
    ax.axis('tight')
    ax.axis('off')
    xlim_start , xlim_end = ax.get_xlim()
    ylim_start , ylim_end = ax.get_ylim()
    
    # 호출 파라미터로 들어온 training 데이타로 model 학습 . 
    model.fit(X, y)
    # meshgrid 형태인 모든 좌표값으로 예측 수행. 
    xx, yy = np.meshgrid(np.linspace(xlim_start,xlim_end, num=200),np.linspace(ylim_start,ylim_end, num=200))
    Z = model.predict(np.c_[xx.ravel(), yy.ravel()]).reshape(xx.shape)
    
    # contourf() 를 이용하여 class boundary 를 visualization 수행. 
    n_classes = len(np.unique(y))
    contours = ax.contourf(xx, yy, Z, alpha=0.3,
                           levels=np.arange(n_classes + 1) - 0.5,
                           cmap='rainbow', clim=(y.min(), y.max()),
                           zorder=1)
In [11]:
# 특정한 트리 생성에 제약이 없는(전체 default 값) Decision Tree의 학습과 결정 경계 시각화
dt_clf = DecisionTreeClassifier().fit(X_features, y_labels)
visualize_boundary(dt_clf, X_features, y_labels)
/anaconda3/lib/python3.7/site-packages/matplotlib/contour.py:1000: UserWarning: The following kwargs were not used by contour: 'clim'
  s)

위의 경우 매우 얇은 영역으로 나타난 부분은 이상치에 해당하는데, 이런 이상치까지 모두 분류하기 위해 분할한 결과 결정 기준 경계가 많아졌습니다.
→이런 경우 조금만 형태가 다른 데이터가 들어와도 정확도가 매우 떨어지게 됩니다.

In [12]:
# min_samples_leaf = 6 으로 설정한 Decision Tree의 학습과 결정 경계 시각화
dt_clf = DecisionTreeClassifier(min_samples_leaf=6).fit(X_features, y_labels)
visualize_boundary(dt_clf, X_features, y_labels)
/anaconda3/lib/python3.7/site-packages/matplotlib/contour.py:1000: UserWarning: The following kwargs were not used by contour: 'clim'
  s)

default 값으로 실행한 앞선 경우보다 이상치에 크게 반응하지 않으면서 일반화된 분류 규칙에 의해 분류되었음을 확인할 수 있습니다.

Decision Tree의 과적합을 줄이기 위한 파라미터 튜닝

(1) max_depth 를 줄여서 트리의 깊이 제한
(2) min_samples_split 를 높여서 데이터가 분할하는데 필요한 샘플 데이터의 수를 높이기
(3) min_samples_leaf 를 높여서 말단 노드가 되는데 필요한 샘플 데이터의 수를 높이기
(4) max_features를 높여서 분할을 하는데 고려하는 feature의 수 제한

6. Decision Tree 실습

사용자 행동 인식 데이터 세트

https://archive.ics.uci.edu/ml/datasets/Human+Activity+Recognition+Using+Smartphones

30명에게 스마트폰 센서를 장착한 뒤 사람의 동작과 관련된 여러 가지 피처를 수집한 데이터
→ 수집된 피처 세트를 기반으로 어떠한 동작인지 예측

  • feature_info.txt 과 README.txt : 데이터 세트와 피처에 대한 간략한 설명
  • features.txt : 피처의 이름 기술
  • activity_labels.txt : 동작 레이블 값에 대한 설명
In [13]:
import pandas as pd
import matplotlib.pyplot as plt
%matplotlib inline

import warnings
warnings.filterwarnings('ignore')
In [14]:
import pandas as pd
import matplotlib.pyplot as plt
%matplotlib inline

# 데이터셋을 구성하는 함수 설정
def get_human_dataset():
    
    # 각 데이터 파일들은 공백으로 분리되어 있으므로 read_csv에서 공백문자를 sep으로 할당
    feature_name_df = pd.read_csv('human_activity/features.txt', sep='\s+',
                                                     header=None, names=['column_index', 'column_name'])
    # 데이터프레임에 피처명을 컬럼으로 뷰여하기 위해 리스트 객체로 다시 반환
    feature_name = feature_name_df.iloc[:, 1].values.tolist()
    
    # 학습 피처 데이터세트와 테스트 피처 데이터를 데이터프레임으로 로딩
    # 컬럼명은 feature_name 적용
    X_train = pd.read_csv('human_activity/train/X_train.txt', sep='\s+', names=feature_name)
    X_test = pd.read_csv('human_activity/test/X_test.txt', sep='\s+', names=feature_name)
    
    # 학습 레이블과 테스트 레이블 데이터를 데이터 프레임으로 로딩, 컬럼명은 action으로 부여
    y_train = pd.read_csv('human_activity/train/y_train.txt', sep='\s+', names=['action'])
    y_test = pd.read_csv('human_activity/test/y_test.txt', sep='\s+', names=['action'])
    
    # 로드된 학습/테스트용 데이터프레임을 모두 반환
    return X_train, X_test, y_train, y_test
In [15]:
X_train, X_test, y_train, y_test = get_human_dataset()
In [16]:
print('## 학습 피처 데이터셋 info()')
X_train.info()
## 학습 피처 데이터셋 info()
<class 'pandas.core.frame.DataFrame'>
RangeIndex: 7352 entries, 0 to 7351
Columns: 561 entries, tBodyAcc-mean()-X to angle(Z,gravityMean)
dtypes: float64(561)
memory usage: 31.5 MB

학습 데이터 셋은 7352개의 레코드와 561개의 피처를 가지고 있습니다.

In [17]:
X_train.head(3)
Out[17]:
tBodyAcc-mean()-X tBodyAcc-mean()-Y tBodyAcc-mean()-Z tBodyAcc-std()-X tBodyAcc-std()-Y tBodyAcc-std()-Z tBodyAcc-mad()-X tBodyAcc-mad()-Y tBodyAcc-mad()-Z tBodyAcc-max()-X ... fBodyBodyGyroJerkMag-meanFreq() fBodyBodyGyroJerkMag-skewness() fBodyBodyGyroJerkMag-kurtosis() angle(tBodyAccMean,gravity) angle(tBodyAccJerkMean),gravityMean) angle(tBodyGyroMean,gravityMean) angle(tBodyGyroJerkMean,gravityMean) angle(X,gravityMean) angle(Y,gravityMean) angle(Z,gravityMean)
0 0.288585 -0.020294 -0.132905 -0.995279 -0.983111 -0.913526 -0.995112 -0.983185 -0.923527 -0.934724 ... -0.074323 -0.298676 -0.710304 -0.112754 0.030400 -0.464761 -0.018446 -0.841247 0.179941 -0.058627
1 0.278419 -0.016411 -0.123520 -0.998245 -0.975300 -0.960322 -0.998807 -0.974914 -0.957686 -0.943068 ... 0.158075 -0.595051 -0.861499 0.053477 -0.007435 -0.732626 0.703511 -0.844788 0.180289 -0.054317
2 0.279653 -0.019467 -0.113462 -0.995380 -0.967187 -0.978944 -0.996520 -0.963668 -0.977469 -0.938692 ... 0.414503 -0.390748 -0.760104 -0.118559 0.177899 0.100699 0.808529 -0.848933 0.180637 -0.049118

3 rows × 561 columns

In [18]:
y_train['action'].value_counts()
Out[18]:
6    1407
5    1374
4    1286
1    1226
2    1073
3     986
Name: action, dtype: int64

레이블 값은 1, 2, 3, 4, 5, 6 의 값을 가지고 있으며 고르게 분포되어 있습니다.

DecisionClassifier 파라미터를 default로 예측 수행

In [19]:
from sklearn.tree import DecisionTreeClassifier
from sklearn.metrics import accuracy_score

# 예제 반복시마다 동일한 예측 결과 도출을 위해 난수값(random_state) 설정
dt_clf = DecisionTreeClassifier(random_state=156)
dt_clf.fit(X_train, y_train)
pred = dt_clf.predict(X_test)
accuracy = accuracy_score(y_test, pred)
print('Decision Tree 예측 정확도 : {0:.4f}'.format(accuracy))

# DecisionTreeClassifier의 하이퍼 파리미터 추출
print('\nDecisionTreeClassifier 기본 하이퍼파라미터:\n', dt_clf.get_params())
Decision Tree 예측 정확도 : 0.8548

DecisionTreeClassifier 기본 하이퍼파라미터:
 {'class_weight': None, 'criterion': 'gini', 'max_depth': None, 'max_features': None, 'max_leaf_nodes': None, 'min_impurity_decrease': 0.0, 'min_impurity_split': None, 'min_samples_leaf': 1, 'min_samples_split': 2, 'min_weight_fraction_leaf': 0.0, 'presort': False, 'random_state': 156, 'splitter': 'best'}

모든 파라미터들을 default를 두고 학습한 결과 약 85.48%의 정확도를 기록했습니다.

Decision Tree의 max_depth가 정확도에 주는 영향

In [20]:
from sklearn.model_selection import GridSearchCV

params = {
    'max_depth' : [6, 8, 10, 12, 16, 20, 24]
         }

grid_cv = GridSearchCV(dt_clf, param_grid=params, scoring='accuracy', cv=5, verbose=1)
grid_cv.fit(X_train, y_train)
print('GridSearchCV 최고 평균 정확도 수치: {:.4f}'.format(grid_cv.best_score_))
print('GridSearchCV 최적 하이퍼파라미터: ', grid_cv.best_params_)

# GridSearchCV 객체의 cv_results_ 속성을 데이터 프레임으로 생성
scores_df = pd.DataFrame(grid_cv.cv_results_)
scores_df[['rank_test_score', 'params','mean_train_score', 'mean_test_score',  'split0_test_score',
           'split1_test_score', 'split2_test_score', 'split3_test_score', 'split4_test_score']]
Fitting 5 folds for each of 7 candidates, totalling 35 fits
[Parallel(n_jobs=1)]: Using backend SequentialBackend with 1 concurrent workers.
[Parallel(n_jobs=1)]: Done  35 out of  35 | elapsed:  1.3min finished
GridSearchCV 최고 평균 정확도 수치: 0.8526
GridSearchCV 최적 하이퍼파라미터:  {'max_depth': 8}
Out[20]:
rank_test_score params mean_train_score mean_test_score split0_test_score split1_test_score split2_test_score split3_test_score split4_test_score
0 4 {'max_depth': 6} 0.944848 0.850925 0.814111 0.873555 0.819728 0.865895 0.881471
1 1 {'max_depth': 8} 0.982693 0.852557 0.820896 0.827328 0.855102 0.868618 0.891008
2 4 {'max_depth': 10} 0.993403 0.850925 0.799864 0.813052 0.863265 0.891082 0.887602
3 7 {'max_depth': 12} 0.997212 0.844124 0.795115 0.813052 0.848980 0.877468 0.886240
4 2 {'max_depth': 16} 0.999660 0.852149 0.799864 0.822570 0.853061 0.887679 0.897820
5 3 {'max_depth': 20} 0.999966 0.851605 0.803256 0.822570 0.856463 0.877468 0.898501
6 6 {'max_depth': 24} 1.000000 0.850245 0.796472 0.822570 0.856463 0.877468 0.898501

Decision Tree의 max_depth가 커질수록 학습정확도는 높아지지만 테스트 데이터셋의 정확도는 max_depth = 8 일 때 가장 높습니다.
→ max_depth를 너무 크게 설정하면 과적합으로 인해 성능이 오히려 하락하게 됩니다.

In [21]:
# GridSearch가 아닌 별도의 테스트 데이터셋에서 max_depth별 성능 측정
max_depths = [6, 8, 10, 12, 16, 20, 24]

for depth in max_depths:
    dt_clf = DecisionTreeClassifier(max_depth=depth, random_state=156)
    dt_clf.fit(X_train, y_train)
    pred = dt_clf.predict(X_test)
    accuracy = accuracy_score(y_test, pred)
    print('max_depth = {0} 정확도 : {1:.4f}'.format(depth, accuracy))
max_depth = 6 정확도 : 0.8558
max_depth = 8 정확도 : 0.8707
max_depth = 10 정확도 : 0.8673
max_depth = 12 정확도 : 0.8646
max_depth = 16 정확도 : 0.8575
max_depth = 20 정확도 : 0.8548
max_depth = 24 정확도 : 0.8548

이 경우에도 max_depth = 8 일 때 가장 높은 정확도를 나타냅니다.
→ max_depth가 너무 커지면 과적합에 빠져 성능이 떨어지게 됩니다. 즉, 너무 복잡한 모델보다 깊이를 낮춘 단순한 모델이 효과적일 수 있습니다.

Decision Tree의 max_depth와 min_samples_split 를 같이 변경하며 성능 튜닝

In [22]:
params = {
    'max_depth' : [6, 8, 10, 12, 16, 20, 24],
    'min_samples_split' : [16, 24]
}

grid_cv = GridSearchCV(dt_clf, param_grid=params, scoring='accuracy', cv=5, verbose=1)
grid_cv.fit(X_train, y_train)
print('GridSearchCV 최고 평균 정확도 수치: {:.4f}'.format(grid_cv.best_score_))
print('GridSearchCV 최적 하이퍼파라미터: ', grid_cv.best_params_)

# GridSearchCV 객체의 cv_results_ 속성을 데이터 프레임으로 생성
scores_df = pd.DataFrame(grid_cv.cv_results_)
scores_df[['rank_test_score', 'params','mean_train_score', 'mean_test_score',  'split0_test_score', 
           'split1_test_score', 'split2_test_score', 'split3_test_score', 'split4_test_score']]
Fitting 5 folds for each of 14 candidates, totalling 70 fits
[Parallel(n_jobs=1)]: Using backend SequentialBackend with 1 concurrent workers.
[Parallel(n_jobs=1)]: Done  70 out of  70 | elapsed:  2.7min finished
GridSearchCV 최고 평균 정확도 수치: 0.8550
GridSearchCV 최적 하이퍼파라미터:  {'max_depth': 8, 'min_samples_split': 16}
Out[22]:
rank_test_score params mean_train_score mean_test_score split0_test_score split1_test_score split2_test_score split3_test_score split4_test_score
0 10 {'max_depth': 6, 'min_samples_split': 16} 0.944202 0.847797 0.814111 0.868797 0.819728 0.866576 0.869891
1 12 {'max_depth': 6, 'min_samples_split': 24} 0.943589 0.846708 0.809362 0.868797 0.819728 0.865895 0.869891
2 1 {'max_depth': 8, 'min_samples_split': 16} 0.979802 0.855005 0.806649 0.830727 0.860544 0.874745 0.902589
3 4 {'max_depth': 8, 'min_samples_split': 24} 0.978204 0.851469 0.807327 0.830727 0.857143 0.872022 0.890327
4 3 {'max_depth': 10, 'min_samples_split': 16} 0.987419 0.852829 0.805292 0.817131 0.866667 0.884275 0.891008
5 2 {'max_depth': 10, 'min_samples_split': 24} 0.984188 0.854189 0.810719 0.819850 0.869388 0.881552 0.889646
6 14 {'max_depth': 12, 'min_samples_split': 16} 0.989391 0.845892 0.798507 0.811013 0.851020 0.884275 0.884877
7 13 {'max_depth': 12, 'min_samples_split': 24} 0.985753 0.846300 0.791723 0.820530 0.855782 0.880871 0.882834
8 11 {'max_depth': 16, 'min_samples_split': 16} 0.990445 0.847252 0.801221 0.815772 0.858503 0.876787 0.884196
9 5 {'max_depth': 16, 'min_samples_split': 24} 0.986739 0.849565 0.805970 0.821210 0.854422 0.878148 0.888283
10 8 {'max_depth': 20, 'min_samples_split': 16} 0.990445 0.848749 0.798507 0.815772 0.858503 0.876787 0.894414
11 6 {'max_depth': 20, 'min_samples_split': 24} 0.986739 0.849293 0.805292 0.821210 0.854422 0.878148 0.887602
12 8 {'max_depth': 24, 'min_samples_split': 16} 0.990445 0.848749 0.798507 0.815772 0.858503 0.876787 0.894414
13 6 {'max_depth': 24, 'min_samples_split': 24} 0.986739 0.849293 0.805292 0.821210 0.854422 0.878148 0.887602

max_depth = 8, min_samples_split = 16일 때 평균 정확도 85.5% 정도로 가장 높은 수치를 나타냈습니다.

해당 파라미터를 적용하여 예측 수행

In [23]:
best_df_clf = grid_cv.best_estimator_
pred1 = best_df_clf.predict(X_test)
accuracy = accuracy_score(y_test, pred1)
print('Desicion Tree 예측 정확도: {0:.4f}'.format(accuracy))
Desicion Tree 예측 정확도: 0.8717

max_depth = 8, min_samples_split = 16일 때 정확도 87.17% 정도의 정확도를 기록했습니다.

Decision Tree의 각 피처의 중요도 시각화 : featureimportances

In [24]:
import seaborn as sns

feature_importance_values = best_df_clf.feature_importances_
# Top 중요도로 정렬하고, 쉽게 시각화하기 위해 Series 변환
feature_importances = pd.Series(feature_importance_values, index=X_train.columns)
# 중요도값 순으로 Series를 정렬
feature_top20 = feature_importances.sort_values(ascending=False)[:20]

plt.figure(figsize=[8, 6])
plt.title('Feature Importances Top 20')
sns.barplot(x=feature_top20, y=feature_top20.index)
plt.show()
3-2. 피마 인디언 당뇨병 예측
  • 목표: 피마 인디언 당뇨병 데이트 세트를 이용하여 당뇨병 여부를 판단하는 머신러닝 예측모델을 수립하고, 여러 평가 지표를 적용

피마 당뇨병 데이터 세트 구성

  • Pregnancies : 임신횟수
  • Glucose : 포도당 부하 검사 수치
  • BloodPressure : 혈압
  • SkinThickness : 팔 삼두근 뒤쪽의 피하지방 측정값
  • Insulin : 혈청 인슐린
  • BMI : 체질량 지수
  • DiabetesPedigreeFunction : 당뇨 내력 가중치 값
  • Age : 나이
  • Outcome : 당뇨여부(0 또는 1)

라이브러리 불러오기

In [2]:
import pandas as pd
import numpy as np
import matplotlib.pyplot as plt
%matplotlib inline

from sklearn.model_selection import train_test_split
from sklearn.metrics import accuracy_score, precision_score, recall_score, roc_auc_score
from sklearn.metrics import f1_score, confusion_matrix, precision_recall_curve, roc_curve
from sklearn.preprocessing import StandardScaler, Binarizer
from sklearn.linear_model import LogisticRegression

import warnings
warnings.filterwarnings('ignore')

데이터 불러오기

In [3]:
diabetes_data = pd.read_csv('pima indian/diabetes.csv')
print(diabetes_data['Outcome'].value_counts())
diabetes_data.head(3)
0    500
1    268
Name: Outcome, dtype: int64
Out[3]:
Pregnancies Glucose BloodPressure SkinThickness Insulin BMI DiabetesPedigreeFunction Age Outcome
0 6 148 72 35 0 33.6 0.627 50 1
1 1 85 66 29 0 26.6 0.351 31 0
2 8 183 64 0 0 23.3 0.672 32 1

전체 768개의 데이터 중 Positive 값 (1)이 268개, Negative(0) 값이 500개로 구성되어 있음

In [4]:
# diabetes 데이터 갼략히 보기(feature type 및 Null 값 개수 보기)
diabetes_data.info()
<class 'pandas.core.frame.DataFrame'>
RangeIndex: 768 entries, 0 to 767
Data columns (total 9 columns):
Pregnancies                 768 non-null int64
Glucose                     768 non-null int64
BloodPressure               768 non-null int64
SkinThickness               768 non-null int64
Insulin                     768 non-null int64
BMI                         768 non-null float64
DiabetesPedigreeFunction    768 non-null float64
Age                         768 non-null int64
Outcome                     768 non-null int64
dtypes: float64(2), int64(7)
memory usage: 54.1 KB

Null 값은 존재하지 않으며 모두 int, float의 숫자형 데이터

--> Null 값과 문자열 처리를 위한 별도의 작업은 필요하지 않음

로지스틱 회귀를 이용한 예측모델 생성

In [5]:
# 평가지표 출력하는 함수 설정
def get_clf_eval(y_test, y_pred):
    confusion = confusion_matrix(y_test, y_pred)
    accuracy = accuracy_score(y_test, y_pred)
    precision = precision_score(y_test, y_pred)
    recall = recall_score(y_test, y_pred)
    F1 = f1_score(y_test, y_pred)
    AUC = roc_auc_score(y_test, y_pred)
    
    print('오차행렬:\n', confusion)
    print('\n정확도: {:.4f}'.format(accuracy))
    print('정밀도: {:.4f}'.format(precision))
    print('재현율: {:.4f}'.format(recall))
    print('F1: {:.4f}'.format(F1))
    print('AUC: {:.4f}'.format(AUC))
In [6]:
# Precision-Recall Curve Plot 그리기
def precision_recall_curve_plot(y_test, pred_proba):
    # threshold ndarray와 이 threshold에 따른 정밀도, 재현율 ndarray 추출
    precisions, recalls, thresholds = precision_recall_curve(y_test, pred_proba)
    
    # x축을 threshold, y축을 정밀도, 재현율로 그래프 그리기
    plt.figure(figsize=(8, 6))
    thresholds_boundary = thresholds.shape[0]
    plt.plot(thresholds, precisions[:thresholds_boundary], linestyle='--', label='precision')
    plt.plot(thresholds, recalls[:thresholds_boundary], linestyle=':', label='recall')
    
    # threshold의 값 X축의 scale을 0.1 단위로 변경
    stard, end = plt.xlim()
    plt.xticks(np.round(np.arange(stard, end, 0.1), 2))
    
    plt.xlim()
    plt.xlabel('thresholds')
    plt.ylabel('precision & recall value')
    plt.legend()
    plt.grid()
In [7]:
# 피쳐 데이터 세트 X, 레이블 데이터 세트 y 를 추출
X = diabetes_data.iloc[:,:-1]
y = diabetes_data['Outcome']

# 데이터를 훈련과 테스트 데이터 셋으로 분리
X_train, X_test, y_train, y_test = train_test_split(X, y, test_size = 0.2, random_state = 156, stratify=y)

# 로지스틱 회귀로 학습, 예측 및 평가 수행
lr_clf = LogisticRegression()
lr_clf.fit(X_train, y_train)
pred = lr_clf.predict(X_test)
get_clf_eval(y_test, pred)
오차행렬:
 [[87 13]
 [22 32]]

정확도: 0.7727
정밀도: 0.7111
재현율: 0.5926
F1: 0.6465
AUC: 0.7313
In [8]:
# 임계값별로 정밀도-재현율 출력
pred_proba = lr_clf.predict_proba(X_test)[:, 1]
precision_recall_curve_plot(y_test, pred_proba)

위의 정밀도-재현율 그래프를 보면 임계값을 약 0.42 정도로 맞추면 정밀도와 재현율이 균형을 이룰 것으로 보임

--> 이 때의 정밀도, 재현율은 0.7이 조금 되지 않는 수준으로 그렇게 높은 것은 아님

--> 데이터를 먼저 다시 확인해서 개선할 부분이 있는지 확인

In [9]:
# 데이터의 기초 통계값들
diabetes_data.describe()
Out[9]:
Pregnancies Glucose BloodPressure SkinThickness Insulin BMI DiabetesPedigreeFunction Age Outcome
count 768.000000 768.000000 768.000000 768.000000 768.000000 768.000000 768.000000 768.000000 768.000000
mean 3.845052 120.894531 69.105469 20.536458 79.799479 31.992578 0.471876 33.240885 0.348958
std 3.369578 31.972618 19.355807 15.952218 115.244002 7.884160 0.331329 11.760232 0.476951
min 0.000000 0.000000 0.000000 0.000000 0.000000 0.000000 0.078000 21.000000 0.000000
25% 1.000000 99.000000 62.000000 0.000000 0.000000 27.300000 0.243750 24.000000 0.000000
50% 3.000000 117.000000 72.000000 23.000000 30.500000 32.000000 0.372500 29.000000 0.000000
75% 6.000000 140.250000 80.000000 32.000000 127.250000 36.600000 0.626250 41.000000 1.000000
max 17.000000 199.000000 122.000000 99.000000 846.000000 67.100000 2.420000 81.000000 1.000000

최소 값이 0으로 되어 있는 값들이 많이 존재함

  • Glucose(당 수치), BloodPressure(혈압), SkinThickness(피하지방), Insulin(인슐린), BMI(체질량 지수) 같은 값이 실제로 0일 수는 없다고 생각되므로 확인이 필요
In [10]:
feature_list = ['Glucose', 'BloodPressure', 'SkinThickness', 'Insulin', 'BMI']

def hist_plot(df):
    for col in feature_list:
        df[col].plot(kind='hist', bins=20).set_title('Histogram of '+col)
        plt.show()

hist_plot(diabetes_data)
In [11]:
# 위 컬럼들에 대한 0 값의 비율 확인
zero_count = []
zero_percent = []
for col in feature_list:
    zero_num = diabetes_data[diabetes_data[col]==0].shape[0]
    zero_count.append(zero_num)
    zero_percent.append(np.round(zero_num/diabetes_data.shape[0]*100,2))

zero = pd.DataFrame([zero_count, zero_percent], columns=feature_list, index=['count', 'percent']).T
zero
Out[11]:
count percent
Glucose 5.0 0.65
BloodPressure 35.0 4.56
SkinThickness 227.0 29.56
Insulin 374.0 48.70
BMI 11.0 1.43

SkinThickness와 Insulin의 경우 0 값의 비율이 각각 29.56%, 48.70%로 상당히 높음

이들 데이터를 삭제하기에는 너무 많으므로 피처 0 값을 평균 값으로 대체

In [12]:
# 0 값들을 우선 NaN 값으로 대체
diabetes_data[feature_list] = diabetes_data[feature_list].replace(0, np.nan)

# 위 5개 feature 에 대해 0값을 평균 값으로 대체
mean_features = diabetes_data[feature_list].mean()
diabetes_data[feature_list] = diabetes_data[feature_list].replace(np.nan, mean_features)
In [13]:
# 데이터 세트에 대해 피처 스케일링을 적용하여 변환하기(로지스틱 회귀의 경우, 숫자 데이터에 스케일링을 적용하는 것이 일반적으로 성능이 좋음)
X = diabetes_data.iloc[:, :-1]
y = diabetes_data.iloc[:, -1]

# StandardScaler 클래스를 상용하여 데이터 세트에 스케일링 적용
scaler = StandardScaler()
X_scaled = scaler.fit_transform(X)

X_train, X_test, y_train, y_test = train_test_split(X_scaled, y, test_size = 0.2, random_state=156, stratify = y)

# 로지스틱 회귀로 학습, 예측, 평가 수행
lr_clf = LogisticRegression()
lr_clf.fit(X_train,  y_train)
pred = lr_clf.predict(X_test)
get_clf_eval(y_test, pred)
오차행렬:
 [[89 11]
 [21 33]]

정확도: 0.7922
정밀도: 0.7500
재현율: 0.6111
F1: 0.6735
AUC: 0.7506

0 값에 대한 처리와 스케일링을 통해 앞선 예측보다는 소폭 개선되었음

In [14]:
# 평가지표를 조사하기 위한 새로운 함수 생성
def get_eval_by_threshold(y_test, pred_proba_c1, thresholds):
    #thresholds list 객체 내의 값을 iteration 하면서 평가 수행
    for custom_threshold in thresholds:
        binarizer = Binarizer(threshold=custom_threshold).fit(pred_proba_c1)
        custom_predict = binarizer.transform(pred_proba_c1)
        print('\n임계값: ', custom_threshold)
        get_clf_eval(y_test, custom_predict)

임계값 변화에 따른 예측 성능 확인

In [15]:
thresholds = [0.3, 0.33, 0.36, 0.39, 0.42, 0.45, 0.48, 0.50]
pred_proba = lr_clf.predict_proba(X_test)
get_eval_by_threshold(y_test, pred_proba[:, 1].reshape(-1, 1), thresholds)
임계값:  0.3
오차행렬:
 [[68 32]
 [ 9 45]]

정확도: 0.7338
정밀도: 0.5844
재현율: 0.8333
F1: 0.6870
AUC: 0.7567

임계값:  0.33
오차행렬:
 [[73 27]
 [11 43]]

정확도: 0.7532
정밀도: 0.6143
재현율: 0.7963
F1: 0.6935
AUC: 0.7631

임계값:  0.36
오차행렬:
 [[75 25]
 [13 41]]

정확도: 0.7532
정밀도: 0.6212
재현율: 0.7593
F1: 0.6833
AUC: 0.7546

임계값:  0.39
오차행렬:
 [[82 18]
 [15 39]]

정확도: 0.7857
정밀도: 0.6842
재현율: 0.7222
F1: 0.7027
AUC: 0.7711

임계값:  0.42
오차행렬:
 [[85 15]
 [18 36]]

정확도: 0.7857
정밀도: 0.7059
재현율: 0.6667
F1: 0.6857
AUC: 0.7583

임계값:  0.45
오차행렬:
 [[86 14]
 [19 35]]

정확도: 0.7857
정밀도: 0.7143
재현율: 0.6481
F1: 0.6796
AUC: 0.7541

임계값:  0.48
오차행렬:
 [[88 12]
 [19 35]]

정확도: 0.7987
정밀도: 0.7447
재현율: 0.6481
F1: 0.6931
AUC: 0.7641

임계값:  0.5
오차행렬:
 [[89 11]
 [21 33]]

정확도: 0.7922
정밀도: 0.7500
재현율: 0.6111
F1: 0.6735
AUC: 0.7506

정확도, 정밀도, 재현율, F1, AUC 등의 평가 지표를 보고 적절히 판단하여 임계값을 재 설정하여 예측을 수행할 수 있음

In [16]:
# 임계값을 0.48로 설정하여 예측 수행
binarizer = Binarizer(threshold=0.48)

# 위에서 구한 predict_proba() 예측확률의 array에서 1에 해당하는 컬럼 값을 대입하여 Binarizer 반환하기
pred_th_048 = binarizer.fit_transform(pred_proba[:, 1].reshape(-1, 1))

get_clf_eval(y_test, pred_th_048)
오차행렬:
 [[88 12]
 [19 35]]

정확도: 0.7987
정밀도: 0.7447
재현율: 0.6481
F1: 0.6931
AUC: 0.7641
3-1. 평가

1. 정확도(Accuracy) : 실제데이터와 예측데이터가 얼마나 같은지를 판단하는 지표

  • 정확도 = 예측 데이터가 동일한 데이터 건수 / 전체 예측 데이터 건수
  • 직관적으로 모델 예측 성능을 나타내는 평가 지표이지만 이진 분류의 경우 데이터의 구성에 따라 모델 성능을 왜곡할 수 있음

    가령, 타이타닉 예제에서도 여성의 생존률이 높았기 때문에, 특별한 알고리즘 없이 여성을 생존, 남성을 사망으로 분류해도 정확도는 높을 수 있음 ( 단순히 하나의 조건만 가지고 결정하는 알고리즘도 높은 정확도를 나타내는 상황이 발생)

사이킷런의 BaseEstimator 클래스를 활용하여, 단순히 성별에 따라 생존자를 예측하는 단순한 분류기를 생성

  • 사이킷런의 BaseEsimators를 활용하면 Customized된 Estimator를 생성할 수 있음
In [1]:
import pandas as pd
import numpy as np
from IPython.display import Image
import warnings 
warnings.filterwarnings('ignore')
In [2]:
### fit() 메서드는 아무 것도 수행하지 않고, predict()는 Sex 피처가 1이면 0, 그렇지 않으면 1로 예측하는 단순한 분류기 생성
from sklearn.base import BaseEstimator

class MyDummyClassifier(BaseEstimator):
    # fit 메서드는 아무것도 학습하지 않음
    def fit(self, X, y=None):
        pass
    # predict 메서드는 단순히 Sex 피처가 1이면 0, 아니면 1로 예측
    def predict(self, X):
        pred = np.zeros( (X.shape[0],1) )
        for i in range(X.shape[0]):
            if X['Sex'].iloc[i] == 1:
                pred[i] = 0
            else :
                pred[i] = 1 
        return pred
In [3]:
## 생성된 MyDummyClassifier를 이용해 타이타닉 생존자 예측 수행

from sklearn.model_selection import train_test_split
from sklearn.metrics import accuracy_score
from sklearn.preprocessing import LabelEncoder

## Null 처리 함수
def fillna(df):
    df['Age'].fillna(df['Age'].mean(), inplace=True)
    df['Cabin'].fillna('N', inplace=True)
    df['Embarked'].fillna('N', inplace=True)
    df['Fare'].fillna(0, inplace=True)
    return df

## 머신러닝에 불필요한 피처 제거
def drop_features(df):
    df.drop(['PassengerId', 'Name', 'Ticket'], axis=1, inplace=True)
    return df

## Label Encoding 수행
def format_features(df):
    df['Cabin'] = df['Cabin'].str[:1]
    features = ['Cabin', 'Sex', 'Embarked']
    for feature in features:
        le = LabelEncoder()
        le.fit(df[feature])
        df[feature] = le.transform(df[feature])
    return df

## 앞에서 실행한 Data Preprocessing 함수 호출
def transform_features(df):
    df = fillna(df)
    df = drop_features(df)
    df = format_features(df)
    return df
In [4]:
# 타이타닉 데이터 로딩 및 학습 데이터 / 테스트 데이터 분할
titanic_df = pd.read_csv('Titanic/input/train.csv')
y_titanic_df = titanic_df['Survived']
X_titanic_df = titanic_df.drop(['Survived'], axis=1)
X_titanic_df = transform_features(X_titanic_df)
X_train, X_test, y_train, y_test = train_test_split(X_titanic_df, y_titanic_df, test_size=0.2, random_state=0)
In [5]:
# 위에서 생성한 Dummy Classifier를 활용해서 학습/예측/평가 수행
myclf = MyDummyClassifier()
myclf.fit(X_train, y_train)

mypredictions = myclf.predict(X_test)
print('Dummy Classifier의 정확도: {0: .4f}'.format(accuracy_score(y_test, mypredictions)))
Dummy Classifier의 정확도:  0.7877

위와 같은 단순한 알고리즘으로 예측을 하더라도 데이터 구성에 따라 정확도는 78.77%로 매우 높은 수치로 나올 수 있기 때문에 정확도를 평가지표로 사용할 때는 매우 신중해야 함.

특히, Imbalanced한 레이블 값 분포에서 모델 성능을 판단할 경우에는 적합한 평가 지표가 아님

  • 가령, 100개의 데이터 중 90개의 레이블이 0, 10개의 레이블이 1인 경우에 무조건 0을 반환하는 모델을 만들면 정확도가 90%가 됨

MNIST 데이터 세트를 변환하여 불균형한 데이터 세트를 만든 뒤 정확도 지표 적용시 어떤 문제가 발생할 수 있는지 살펴보기

  • MNIST 데이터세트: 0부터 9까지의 숫자 이미지의 픽셀 정보를 가지고 있으며, 이를 기반으로 숫자 Digit을 예측하는데 사용
    • 0부터 9까지의 멀티레이블이지만 True, 나머지는 False인 불균형한 데이터 세트로 변환
    • 이후에 모든 데이터를 False(0)으로 예측하는 분류기를 만들어 정확도를 측정
    • 결과적으로 아무것도 하지 않고, 특정 결과로만 결과를 반환해도 정확도가 높게 측정되어 모델 성능이 높게 나타나는 현상이 발생
In [6]:
from sklearn.datasets import load_digits
from sklearn.model_selection import train_test_split
from sklearn.base import BaseEstimator
from sklearn.metrics import accuracy_score

import numpy as np
import pandas as pd

class MyFakeClassifier(BaseEstimator):
    def fit(self, X, y):
        pass
    
    # 입력값으로 들어오는 X 데이터 세트의 크기만큼 모두 0으로 만들어서 반환
    def predict(self, X):
        return np.zeros((len(X),1), dtype=bool)
        
# 사이킷런의 내장 데이터 셋인 load_digits()를 이용하여 MNIST 데이터 로딩
digits = load_digits()

# digits 번호가 7이면 True이고 이를 astype(int)로 1로 변환, 7이 아니면 False이고 0으로 변환
y=(digits.target == 7).astype(int)

# 훈련셋, 테스트셋으로 데이터 분할
X_train, X_test, y_train, y_test = train_test_split(digits.data, y, random_state=11)
In [7]:
# 불균형한 레이블 데이터 분포도 확인
print('레이블 테스트 데이터 크기: ', y_test.shape)
print('테스트 데이터 세트 레이블 0과 1의 분포도: ')
print(pd.Series(y_test).value_counts())

# FakeClassifier를 통해 학습/예측/정확도 평가
fakeclf = MyFakeClassifier()
fakeclf.fit(X_train, y_train)
fake_prediction = fakeclf.predict(X_test)
print('모든 예측을 0으로 했을 때의 정확도: ', accuracy_score(y_test, fake_prediction))
레이블 테스트 데이터 크기:  (450,)
테스트 데이터 세트 레이블 0과 1의 분포도: 
0    405
1     45
dtype: int64
모든 예측을 0으로 했을 때의 정확도:  0.9

위와 같이 단순히 한 가지 값만으로 결과를 반환해도 정확도의 90%를 나타냄

이처럼 정확도 평가지표는 불균형한 레이블 데이터 셋에서는 성능지표로 사용되서는 안됨

→ 이를 극복하기 위해 정확도는 여러 지표와 함께 적용되어야 함

2. 오차행렬/혼동행렬 (Confusion Matrix)

: 분류 문제에서 예측 오류가 얼마인지, 어떤 유형의 오류가 발생하고 있는지를 함께 나타내는 지표

In [8]:
Image('image/confusionMatrx.png', width = 700)
Out[8]:
  • $TN(True Negative)$ : 실제 값이 Negative인데 예측 값도 Negative
  • $FP(False Positive)$ : 실제 값이 Negative인데 예측 값을 Positive
  • $FN(False Negative)$ : 실제 값이 Positive인데 예측 값을 Negative
  • $TP(True Positive)$ : 실제 값이 Positive인데 예측 값도 Positive

사이킷런에서는 오차행렬을 구하기 위해 confusion_matrix( )를 제공

In [9]:
# MyFakeClassifier의 예측 결과인 fakepred와 실제결과인 y_test를 confusion_matrix의 인자로 입력해서 출력
from sklearn.metrics import confusion_matrix

cm = confusion_matrix(y_test, fake_prediction)
cm
Out[9]:
array([[405,   0],
       [ 45,   0]])

오차행렬은 ndarray형태로 TP, FP, FN, TN은 위의 상단 표와 동일하게 배치

위의 결과를 보면 총 450개의 값 중

  • TN : 405개, TP : 0개, FN : 45개, FP : 0개
In [10]:
print('True Negative : ' , cm[0][0], ' --> (7이 아닌데 7이 아니라고 예측)')
print('False Positive : ', cm[0][1], '--> (7이 아닌데 7이라고 예측)')
print('False Negative : ', cm[1][0], '--> (7인데 7이 아니라고 예측)')
print('True Positigve: ', cm[1][1], '--> (7인데 7이라고 예측)')
True Negative :  405  --> (7이 아닌데 7이 아니라고 예측)
False Positive :  0 --> (7이 아닌데 7이라고 예측)
False Negative :  45 --> (7인데 7이 아니라고 예측)
True Positigve:  0 --> (7인데 7이라고 예측)

3. 오차행렬을 통해 알 수 있는 지표들

  • $ Accuracy (정확도) = \frac{TN+TP}{TN+FP+FN+TP}\ $

    → 예측결과와 실제값이 동일한 건수 / 전체 데이터 수
  • $ Precision (정밀도) = \frac{TP}{FP+TP}\ $

    → 예측대상(Positive)을 정확히 예측한 수 / Positive로 예측한 데이터 수
  • $ Recall(재현율) , Sensitivity(민감도), True Positive Rate(TPR) = \frac{TP}{FN+TP}\ $

    → Positive를 정확히 예측한 수 / 전체 Positive 데이터 수
  • $ Specificity(특이성), True Negative Rate(TNR) = \frac{TN}{TN+FP}\ $

    → Negative를 정확히 예측한 수 / 전체 Negative 데이터 수

업무 특성에 따라서 특정지표가 유용하게 사용

ex) Recall(재현율) : 암 판정, 사기 판정 / Precision(정밀도) : 스팸메일 분류

  • 사이킷런에서는 정밀도 계산을 위해 precision_score( ) , 재현율 계산을 위해 recall_score( ) 를 제공
In [11]:
# 사이킷런의 정확도, 정밀도, 재현율, 오차행렬을 계산하는 API 호출
from sklearn.metrics import accuracy_score, precision_score, recall_score, confusion_matrix

# 호출한 지표들을 한꺼번에 계산하는 함수 정의
def get_clf_eval(y_test, pred):
    confusion = confusion_matrix(y_test, pred)
    accuracy = accuracy_score(y_test, pred)
    precision = precision_score(y_test, pred)
    recall = recall_score(y_test, pred)
    print('오차행렬')
    print(confusion)
    print('정확도 : {:.4f}\n정밀도 : {:.4f}\n재현율 : {:.4f}'.format(accuracy, precision, recall))
In [12]:
# 로지스틱 회귀 기반으로 타이타닉 생존자를 예측 후 평가 수행
from sklearn.linear_model import LogisticRegression

titanic_df = pd.read_csv('Titanic/input/train.csv')
y_titanic_df = titanic_df['Survived']
X_titanic_df = titanic_df.drop('Survived', axis=1)
X_titanic_df = transform_features(X_titanic_df)

X_train, X_test, y_train, y_test = train_test_split(X_titanic_df, y_titanic_df, test_size = 0.2, random_state = 11)

lr_clf = LogisticRegression()
lr_clf.fit(X_train, y_train)
pred = lr_clf.predict(X_test)
get_clf_eval(y_test, pred)
오차행렬
[[108  10]
 [ 14  47]]
정확도 : 0.8659
정밀도 : 0.8246
재현율 : 0.7705

4. 정밀도/재현율 트레이드오프

  • 정밀도와 재현율은 상호보완적인 지표로 한쪽을 높이려고 하다보면 다른 한쪽이 떨어지기 쉬움
  • 사이킷런의 분류 알고리즘은 예측 데이터가 특정 레이블에 속하는지 판단하기 위해 개별 레이블별로 확률을 구하고, 그 확률이 큰 레이블 값으로 예측
    • 일반적으로는 임계값을 50%로 정하고 이보다 크면 Positive, 작으면 Negative로 결정
    • predict_proba( ) 를 통하여 개별 레이블별 예측확률을 반환받을 수 있음
In [13]:
# 타이타닉  생존자 데이터에서 predict() 결과 값과 predict_proba() 결과 값을 비교
pred_proba = lr_clf.predict_proba(X_test)
pred = lr_clf.predict(X_test)

print('pred_proba의 shape: {0}'.format(pred_proba.shape))
print('pred_proba의 array에서 앞 3개만 샘플로 추출 :\n', pred_proba[:3])

#예측확률 array와 예측 결과값 array를 병합하여 예측확률과 결괏값을 한 번에 확인
pred_proba_result = np.concatenate([pred_proba, pred.reshape(-1,1)], axis=1)
print('두 개의 class 중 더 큰 확률을 클래스 값으로 예측\n', pred_proba_result[:3])
pred_proba의 shape: (179, 2)
pred_proba의 array에서 앞 3개만 샘플로 추출 :
 [[0.44935227 0.55064773]
 [0.86335512 0.13664488]
 [0.86429645 0.13570355]]
두 개의 class 중 더 큰 확률을 클래스 값으로 예측
 [[0.44935227 0.55064773 1.        ]
 [0.86335512 0.13664488 0.        ]
 [0.86429645 0.13570355 0.        ]]

반환 결과인 ndarray는 0과 1에 대한 확률을 나타내므로 첫번째 컬럼과 두번째 컬럼의 합은 1이 됨

그리고 두 확률 중 큰 값의 레이블 값으로 predict( ) 메서드가 최종 예측

정밀도/재현율 트레이드오프를 살펴보기 위해 로직을 구현해보기

  • 사이킷런의 Binarizer 클래스 : fit_transform()을 이용하여 정해진 threshold 보다 같거나 작으면 0, 크면 1로 변환하여 반환
In [14]:
from sklearn.preprocessing import Binarizer

# 예시
X = [[-1, -1, 2],
        [2, 0, 0], 
        [0, 1.1, 1.2]]

# X의 개별원소들이 threshold보다 크면 1, 작거나 같으면 0을 반환
binarizer = Binarizer(threshold=1.1)
print(binarizer.fit_transform(X))
[[0. 0. 1.]
 [1. 0. 0.]
 [0. 0. 1.]]

앞선 Logistic Regression 객체의 predict_proba()의 결과 값에 Binarizer클래스를 적용하여 최종 예측 값을 구하고, 최종 예측 값에 대해 평가해보기

In [15]:
# Binarizer의 threshold 값을 0.5로 설정
custom_threshold = 0.5

# predict_proba() 결과 값의 두 번째 컬럼, 즉 Positive 클래스의 컬럼 하나만 추출하여 Binarizer를 적용
pred_proba_1 = pred_proba[:,1].reshape(-1,1)

binarizer = Binarizer(threshold=custom_threshold).fit(pred_proba_1)
custom_predict = binarizer.transform(pred_proba_1)

get_clf_eval(y_test, custom_predict)
오차행렬
[[108  10]
 [ 14  47]]
정확도 : 0.8659
정밀도 : 0.8246
재현율 : 0.7705
In [16]:
# Binarizer의 threshold 값을 0.4로 설정
custom_threshold = 0.4

# predict_proba() 결과 값의 두 번째 컬럼, 즉 Positive 클래스의 컬럼 하나만 추출하여 Binarizer를 적용
pred_proba_1 = pred_proba[:,1].reshape(-1,1)

binarizer = Binarizer(threshold=custom_threshold).fit(pred_proba_1)
custom_predict = binarizer.transform(pred_proba_1)

get_clf_eval(y_test, custom_predict)
오차행렬
[[97 21]
 [11 50]]
정확도 : 0.8212
정밀도 : 0.7042
재현율 : 0.8197

→ threshold를 낮추니 정밀도는 떨어지고, 재현율이 올라감 (즉, 0.4부터 Positive로 예측을 하니, 전체 Positive 수 대비 Positive로 예측된 값의 수가 많아짐)

임계값을 0.4에서부터 0.6까지 0.05씩 증가시키며 평가지표를 조사

In [17]:
# 임계값
thresholds = [0.4, 0.45, 0.5, 0.55, 0.6]

# 평가지표를 조사하기 위한 새로운 함수 생성
def get_eval_by_threshold(y_test, pred_proba_c1, thresholds):
    #thresholds list 객체 내의 값을 iteration 하면서 평가 수행
    for custom_threshold in thresholds:
        binarizer = Binarizer(threshold=custom_threshold).fit(pred_proba_c1)
        custom_predict = binarizer.transform(pred_proba_c1)
        print('\n임계값: ', custom_threshold)
        get_clf_eval(y_test, custom_predict)

get_eval_by_threshold(y_test, pred_proba[:,1].reshape(-1, 1), thresholds)
임계값:  0.4
오차행렬
[[97 21]
 [11 50]]
정확도 : 0.8212
정밀도 : 0.7042
재현율 : 0.8197

임계값:  0.45
오차행렬
[[105  13]
 [ 13  48]]
정확도 : 0.8547
정밀도 : 0.7869
재현율 : 0.7869

임계값:  0.5
오차행렬
[[108  10]
 [ 14  47]]
정확도 : 0.8659
정밀도 : 0.8246
재현율 : 0.7705

임계값:  0.55
오차행렬
[[111   7]
 [ 16  45]]
정확도 : 0.8715
정밀도 : 0.8654
재현율 : 0.7377

임계값:  0.6
오차행렬
[[113   5]
 [ 17  44]]
정확도 : 0.8771
정밀도 : 0.8980
재현율 : 0.7213
  • precision_recall_curve(실제 클래스 값, 예측 확률 값) : 임계값 변화에 따른 평가 지표 값을 반환하는 API
    • 반환 값 : 정밀도 - 임계값별 정밀도 값을 배열으로 반환, 재현율 - 임계값별 재현율 값을 배열으로 반환
In [18]:
from sklearn.metrics import precision_recall_curve

# 레이블 값이 1일 떄의 예측확률을 추출
pred_proba_class1 = lr_clf.predict_proba(X_test)[ : , 1]

# 실제값 데이터 세트와 레이블 값이 1일 때 예측확률을 precision_recall_curve의 인자로 반환
precisions, recalls, thresholds = precision_recall_curve(y_test, pred_proba_class1)
print('반환된 분류 결정 임계값 배열의 shape: ', thresholds.shape)

# 반환된 임계값 배열 로우가 147건 이므로 샘플로 10건만 추출하되, 임계값을 15 Step으로 추출
thr_index = np.arange(0, thresholds.shape[0], 15)
print('샘플 추출을 위한 임계값 배열의 index 10개: ', thr_index)
print('샘플용 10개의 임계값: ', np.round(thresholds[thr_index], 2))

# 15 step 단위로 추출된 임계값에 따른 정밀도와 재현율 값
print('샘플 임계값별 정밀도 : ', np.round(precisions[thr_index], 3))
print('샘플 임계값별 재현율 : ', np.round(recalls[thr_index], 3))
반환된 분류 결정 임계값 배열의 shape:  (147,)
샘플 추출을 위한 임계값 배열의 index 10개:  [  0  15  30  45  60  75  90 105 120 135]
샘플용 10개의 임계값:  [0.12 0.13 0.15 0.17 0.26 0.38 0.49 0.63 0.76 0.9 ]
샘플 임계값별 정밀도 :  [0.379 0.424 0.455 0.519 0.618 0.676 0.797 0.93  0.964 1.   ]
샘플 임계값별 재현율 :  [1.    0.967 0.902 0.902 0.902 0.82  0.77  0.656 0.443 0.213]

정밀도와 재현율 값을 살펴보면 임계값이 증가할 수록 정밀도 값은 동시에 높아지나 재현율 값이 낮아짐을 알 수 있음

In [19]:
import matplotlib.pyplot as plt
import matplotlib.ticker as ticker
%matplotlib inline

def precision_recall_curve_plot(y_test, pred_proba_c1):
    # threshold ndarray와 이 threshold에 따른 정밀도, 재현율 ndarray 추출
    precisions, recalls, thresholds = precision_recall_curve(y_test, pred_proba_c1)
    
    # x축을 threshold 값, y축을 정밀도, 재현율로 그리기
    plt.figure(figsize=(8,6))
    thresholds_boundary = thresholds.shape[0]
    plt.plot(thresholds, precisions[0: thresholds_boundary], linestyle= '--', label='precision')
    plt.plot(thresholds, recalls[0: thresholds_boundary], label='recall')
    
    # threshold의 값 X축의 scale을 0.1 단위로 변경
    stard, end = plt.xlim()
    plt.xticks(np.round(np.arange(stard, end, 0.1), 2))
    
    # x축, y축 label과 legend, 그리고 grid 설정
    plt.xlabel('Threshold value')
    plt.ylabel('Precision and Recall value')
    plt.legend()
    plt.grid()
    plt.show()

precision_recall_curve_plot(y_test, lr_clf.predict_proba(X_test)[:,1])

4. F1 스코어

정밀도와 재현율을 결합한 지표로 정밀도와 재현율이 어느 한 쪽으로 치우치지 않을 때 상대적으로 높은 값을 가짐

$$ F1 = \frac {2}{\frac{1}{recall}+\frac{1}{precision}}\ = 2 * \frac{precision * recall}{precision+recall}\ $$

예시 ) 모델 A : 정밀도 0.9, 재현율이 0.1 , 모델 B : 정밀도 0.5, 재현율 0.5 일 때

→ 모델 A의 F1 = 0.18 , 모델 B의 F1 = 0.5

f1_score(실제값, 예측값) : 사이킷런에서 F1스코어를 측정

In [20]:
from sklearn.metrics import f1_score
f1 = f1_score(y_test, pred)
print('F1 스코어 : {:.4f}'.format(f1))
F1 스코어 : 0.7966

타이타닉 생존자 예측에서 임계값을 변화시키며 F1 스코어, 정밀도, 재현율 구하기

In [21]:
def get_clf_eval(y_test, pred):
    confusion = confusion_matrix(y_test, pred)
    accuracy = accuracy_score(y_test, pred)
    precision = precision_score(y_test, pred)
    recall = recall_score(y_test, pred)
    # F1 스코어 추가
    f1 = f1_score(y_test, pred)
    print('오차행렬')
    print(confusion)
    # F1 score print 추가
    print('\n정확도: {:.4f}\n정밀도: {:.4f}\n재현율: {:.4f}\nF1: {:.4f}'.format(accuracy, precision, recall, f1))
    
thresholds = [0.4, 0.45, 0.5, 0.55, 0.6]
pred_proba = lr_clf.predict_proba(X_test)
get_eval_by_threshold(y_test, pred_proba[:,1].reshape(-1, 1), thresholds)
임계값:  0.4
오차행렬
[[97 21]
 [11 50]]

정확도: 0.8212
정밀도: 0.7042
재현율: 0.8197
F1: 0.7576

임계값:  0.45
오차행렬
[[105  13]
 [ 13  48]]

정확도: 0.8547
정밀도: 0.7869
재현율: 0.7869
F1: 0.7869

임계값:  0.5
오차행렬
[[108  10]
 [ 14  47]]

정확도: 0.8659
정밀도: 0.8246
재현율: 0.7705
F1: 0.7966

임계값:  0.55
오차행렬
[[111   7]
 [ 16  45]]

정확도: 0.8715
정밀도: 0.8654
재현율: 0.7377
F1: 0.7965

임계값:  0.6
오차행렬
[[113   5]
 [ 17  44]]

정확도: 0.8771
정밀도: 0.8980
재현율: 0.7213
F1: 0.8000

5. ROC곡선과 AUC

$ROC 곡선$ : FPR(False Positive Rate)이 변할 때 TPR(True Positive Rate)이 어떻게 변하는지를 나타내는 곡선

  • $ Recall(재현율) , Sensitivity(민감도),TPR = \frac{TP}{FN+TP}\ $

    → 실제값 Positive가 정확이 예측되야 하는 수준(질병 보유자를 질병을 보유한 것으로 판정)
  • $ Specificity(특이성), True Negative Rate(TNR) = \frac{TN}{TN+FP}\ $

    → 실제값 Negative가 정확히 예측되야 하는 수준(건강한 사람을 건강하다고 판정)
  • $FPR = 1 - Specificity = \frac{FP}{TN+FP}\ $ --> 실제값 Negative 중 Positive로 잘못 예측된 비율(건강한 사람을 질병이 있다고 판정)
In [22]:
Image('image/ROC-curve.png', width=500)
Out[22]:
  • 위의 그림은 ROC 곡선의 예시이며 가운데 직선은 ROC 곡선의 최저 값

    • 가운데 직선은 동전을 무작위로 던져 앞/뒤를 맞추는 랜덤 수준의 이진 분류 ROC 직선
  • 곡선이 가운데 직선에 가까울 수록 성능이 떨어지는 것이며 멀어질수록 성능이 뛰어난 것
  • ROC 곡선은 FPR을 0부터 1까지 변경하면서 TPR의 변화 값을 구함

    • 분류결정 임계값을 변경함으로써 FPR을 변화시킴('임계값=1'이면 Negative 값을 Positive로 예측하지 않고 FPR이 0이됨, 반대로 임계값을 낮출수록 FPR이 올라감)

roc_curve(실제값, 예측 확률 값) : FPR, TPR, 임계값을 반환

타이타닉 생존자 예측모델의 FPR, TPR, 임계값 구하기

In [23]:
from sklearn.metrics import roc_curve

# 레이블 값이 1일 때 예측 확률을 추출
pred_proba_class1 = lr_clf.predict_proba(X_test)[:,1]

fprs, tprs, thresholds = roc_curve(y_test, pred_proba_class1)
# 반환된 임계값 배열 로우가 47건이므로 샘플로 10건만 추출하되 임계값을 5step으로 추출
thr_index = np.arange(1, thresholds.shape[0], 5)
print('샘플 추출을 위한 임계값 배열의 index 10개: ', thr_index)
print('샘플용 10개의 임계값: ', np.round(thresholds[thr_index], 2))

# 5 step으로 추출된 임계값에 따른 FPR, TPR 값
print('샘플 임계값별 FPR: ', np.round(fprs[thr_index], 3))
print('샘플 임계값별 TPR: ', np.round(tprs[thr_index], 3))
샘플 추출을 위한 임계값 배열의 index 10개:  [ 1  6 11 16 21 26 31 36 41 46]
샘플용 10개의 임계값:  [0.94 0.73 0.62 0.52 0.44 0.28 0.15 0.14 0.13 0.12]
샘플 임계값별 FPR:  [0.    0.008 0.025 0.076 0.127 0.254 0.576 0.61  0.746 0.847]
샘플 임계값별 TPR:  [0.016 0.492 0.705 0.738 0.803 0.885 0.902 0.951 0.967 1.   ]

roc_curve( ) 의 결과값을 보면 임계값이 1에 가까운 값에서 점점 작아지면서 FPR이 점점 커짐

FPR이 조금씩 커질 때 FPR은 가파르게 커짐

In [24]:
# ROC 곡선의 시각화
def roc_curve_plot(y_test, pred_proba_c1):
    #임계값에 따른 FPR, TPR 값을반환 받음
    fprs, tprs, thresholds  = roc_curve(y_test, pred_proba_c1)
    # ROC곡선을 그래프로 그림
    plt.plot(fprs, tprs, label='ROC')
    # 가운데 대각선 직선을 그림
    plt.plot([0,1], [0,1], 'k--', label='Random')
    
    # FPR X축의 Scale을 0.1 단위로 변경, X, Y축 명 설정 등
    start, end = plt.xlim()
    plt.xticks(np.round(np.arange(start, end, 0.1), 2))
    plt.xlim(0, 1)
    plt.ylim(0, 1)
    plt.xlabel('FPR(1-Sensitivity)')
    plt.ylabel('TPR(Recall)')
    plt.legend()
    
roc_curve_plot(y_test, pred_proba[:, 1])

일반적으로 ROC 곡선 자체는 FPR과 TPR의 변화 값을 보는데 이용하여 분류의 성능지표로는 ROC면적에 기반한 AUC 값으로 결정

  • AUC(Area Under Curve) : 곡선 밑의 면적 값으로 1에 가까울 수록 좋은 수치, 대각선 직선일 때 0.5
  • roc_auc_score( ) : AUC 면적을 구하는 사이킷런 API
In [25]:
from sklearn.metrics import roc_auc_score

pred = lr_clf.predict(X_test)
roc_score = roc_auc_score(y_test, pred)
print('ROC AUC 값 : {:.4f}'.format(roc_score))
ROC AUC 값 : 0.8429

+ Recent posts